Understanding exception reports
Exceptions that occur during run time are flagged up in the console as normal. With Performance Reporting enabled, these exceptions are also reported to the Performance Reporting Dashboard.

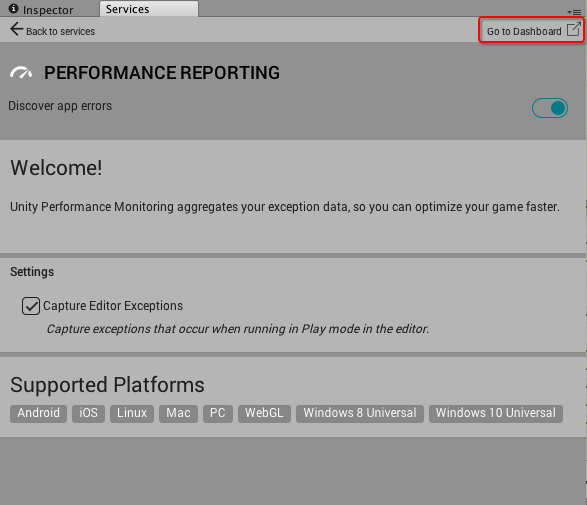
The Dashboard is accessed online via your Internet browser. To view it, open the Performance Reporting panel in the Unity Editor and select Go to Dashboard:

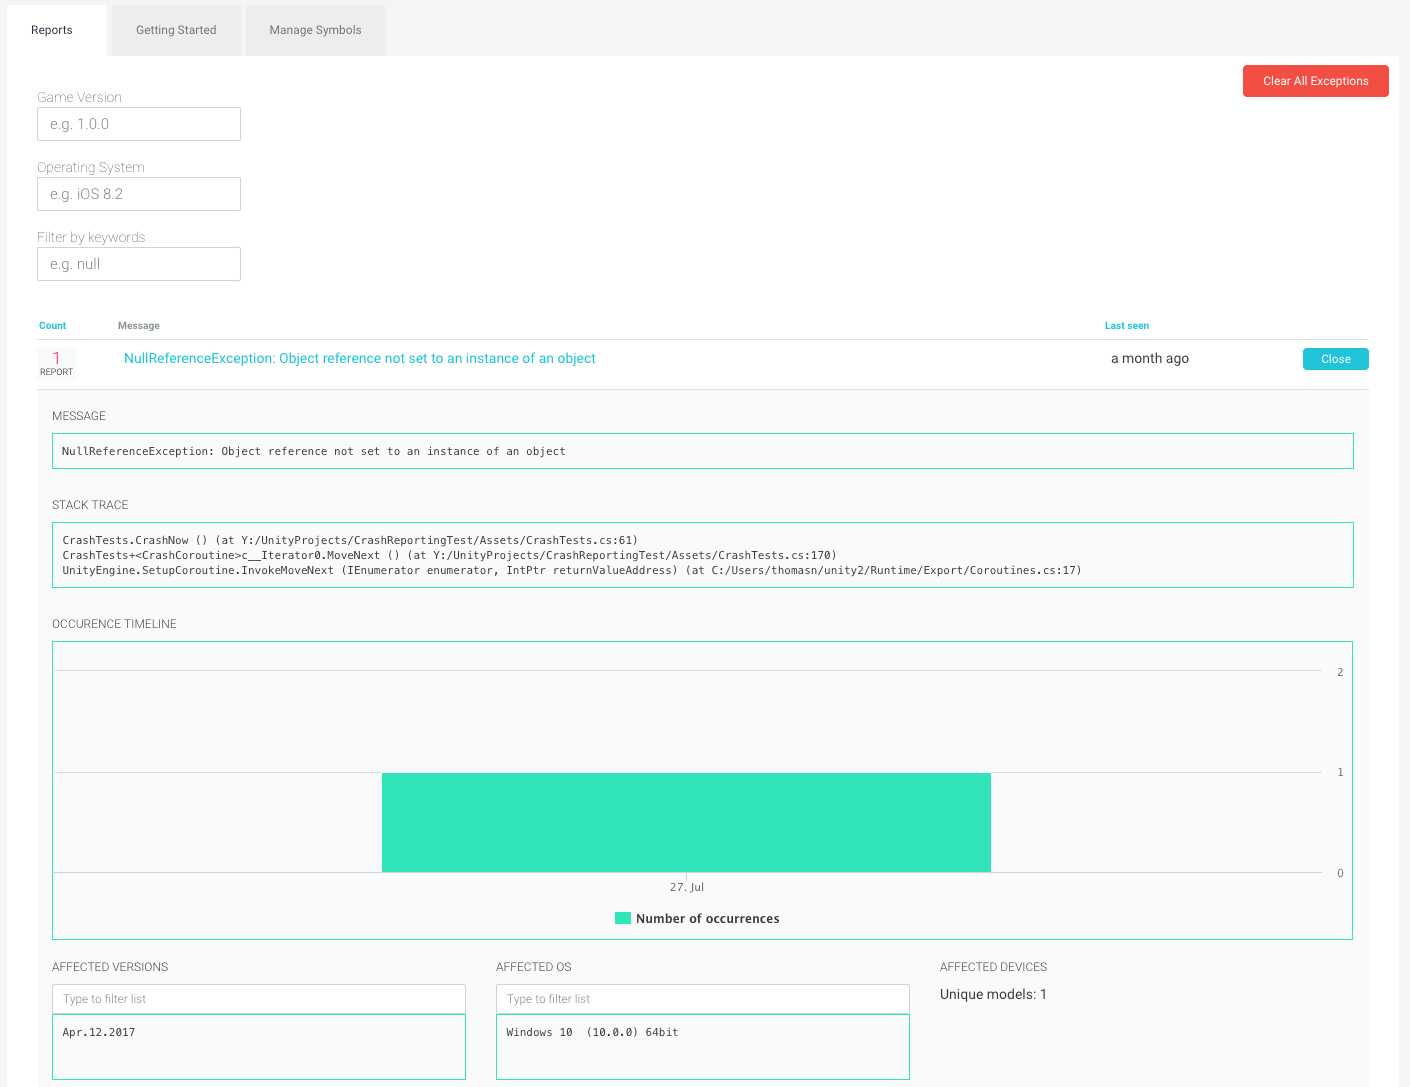
The Dashboard displays a list of your most recent exceptions. For more information about a specific exception, click on the exception to expand the view:

The expanded version shows you the console message, the stack trace, an occurrence timeline, affected versions of the game, affected operating systems, and affected devices.
Manage Symbols tab
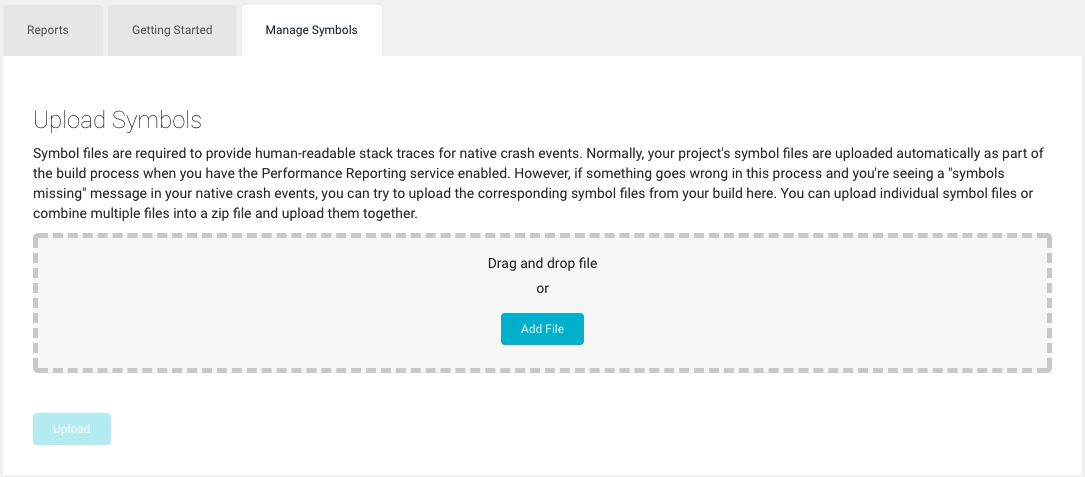
Symbol files are required to provide human-readable stack traces for native crash events. Normally, your project’s symbol files are uploaded automatically as part of the build process when you have the Performance Reporting service enabled. However, if something goes wrong in this process and you’re seeing a “symbols missing” message in your native crash events, you can try to upload the corresponding symbol files from your build here. You can upload individual symbol files or combine multiple files into a zip file and upload them together.
The symbol upload processor can handle the following formats:
- Mach-O: iOS/OSX, a .dSYM folder
- ELF: Android/Linux, a .so file
- PDB: Windows, a .pdb file
The UUID or GUID identifier of your symbol file must match what the dashboard is showing as missing in order for symbolication to be successful. Tools such as dwarfdump -u (OSX) and readelf -n (Linux) can help you check these. Some tools report the UUID with dashes in it, but the dashes and the casing are not important as long as the bytes of the identifier match those shown on the dashboard.

- 2017–09–04 Page amended with limited editorial review
- Added Manage Symbols tab in Unity 5.6
Did you find this page useful? Please give it a rating: