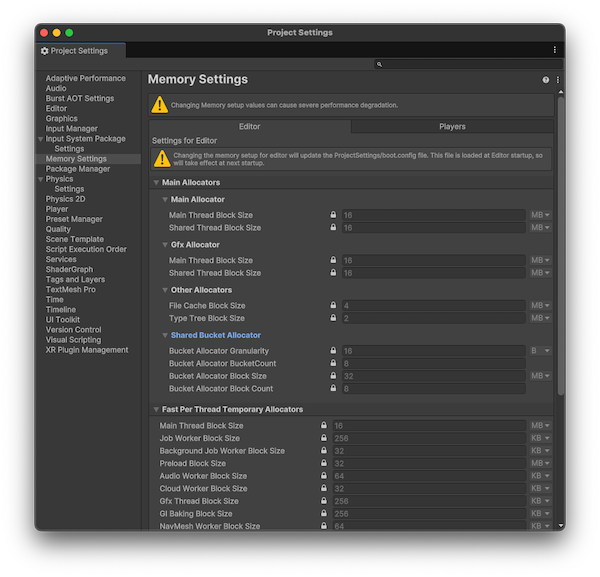
Customizing native memory allocators
To customize allocator settings you can either edit the configurable values through the Unity Editor or supply them as command line arguments.
Using the Editor
- Open the Project Settings window (Edit > Project Settings).
- Select the Memory Settings panel.
- Select the lock icon next to the value you want to edit.

For more information on how the values affect each allocator, refer to Native memory allocator examples.
Using command line arguments
You can use command line arguments to set the size of each allocator. To find the name of the allocator parameters you want to change, check the list of allocator settings the Editor and players print when they start up.
For example, to change the block size of the main heap allocators, use the following:
-memorysetup-main-allocator-block-size=<new_value>
For a full list of command line arguments, refer to Native memory allocators reference.
Measuring the performance of changes
To ensure your settings improve performance, profile your application before and after making changes. For more information, refer to the Profiler overview page.
You can also use the Profiler Analyzer package to measure changes. The ProfilerA window that helps you to optimize your game. It shows how much time is spent in the various areas of your game. For example, it can report the percentage of time spent rendering, animating, or in your game logic. More info
See in Glossary Analyzer enables you to compare multiple frames, and two different Profiler captures to each other. Comparing two captures is useful for highlighting differences in allocator performance between two different runs with different settings.
You can also check the memory usage reports, which are available in the log when you close the Player or Editor. To find your log files, follow the instructions on the log files page.
Storing and reading the settings
Unity stores allocator settings in MemorySettings.asset and these settings are applied during the build process. This means new settings take effect at every build.
In the Editor, these settings are stored in the ProjectSettings folder and are updated every time Unity imports or changes MemorySettings.asset. New values for the Editor only take effect on the next Editor startup.