Creating Profiler modules
A ProfilerA window that helps you to optimize your game. It shows how much time is spent in the various areas of your game. For example, it can report the percentage of time spent rendering, animating, or in your game logic. More info
See in Glossary module displays performance data from your system in the Profiler window.
You can create your own profiler module in one of the following ways:
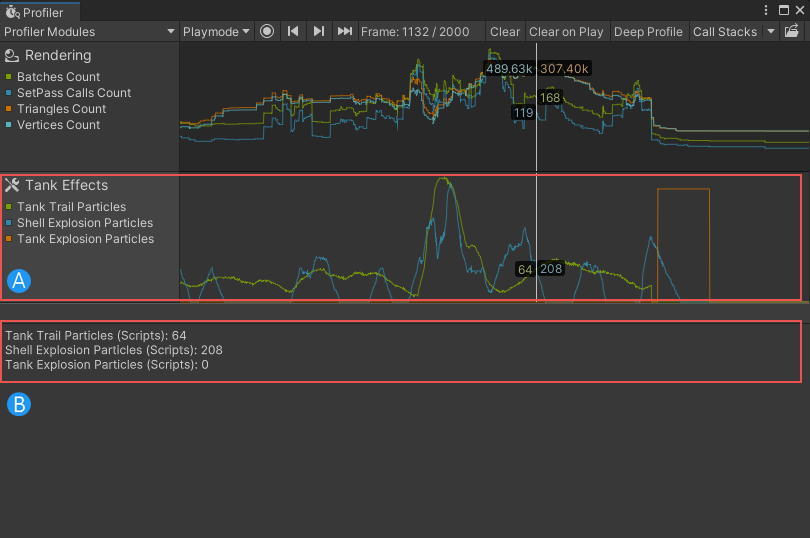
A custom module displays the counters you specified in code in the Profiler window chart view (A), and the counters appear as a list in the module details panel (B).

Creating Profiler modules with the Profiler Module Editor
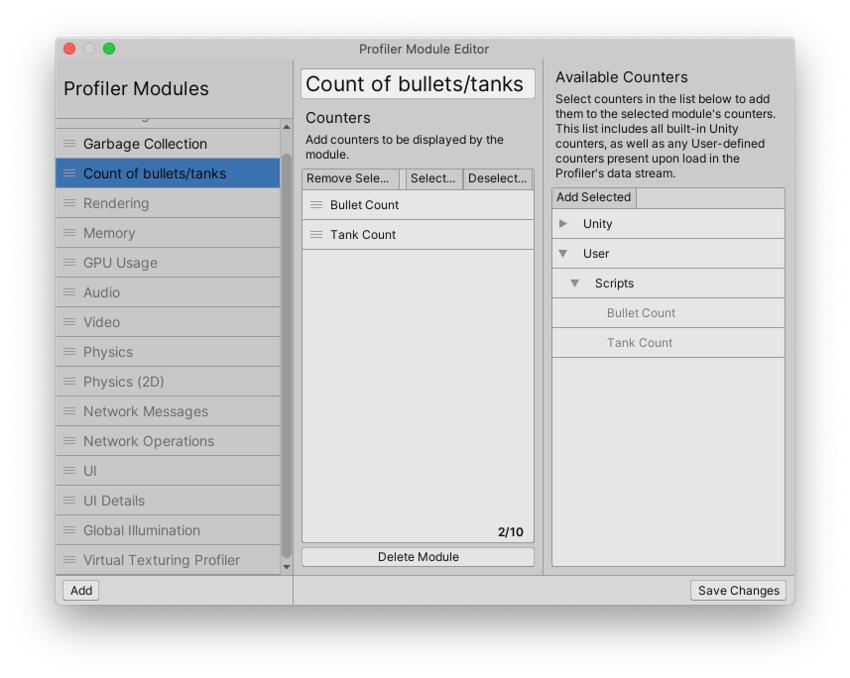
You can use Unity’s built-in Profiler Module Editor to create your own Profiler module. To collect data in your Profiler module, you must add at least one counter for the module to track. You can add both built-in Unity counters, or use the ProfilerCounter API to create your own counters to add to the module. The list of available counters appears in the Available Counters pane.
To create your own module:
- Open the Profiler window (Window > Analysis > Profiler).
- Select the Profiler Modules dropdown, then select the cog icon. The Profiler Module Editor opens.
- Select the Add button in the bottom left corner of the window. Unity then adds a new Profiler module to the list called New Profiler Module. To rename the module, click the text field and use your keyboard to set a name.
- Select the counters you want to display in the module from the Available Counters panel, then double click on them to add them to the module. To select multiple counters, hold Shift and click to select a range, or hold down Ctrl (Command on macOS) to select counters one at a time.
- To reorder the counters, drag them. You can only add a maximum of 10 counters to a module.
- Select the Save Changes button in the bottom right corner of the Profiler Module Editor window. Unity closes the window, and Unity displays the new module in the Profiler Window.
Important: If you don’t have any data loaded into the Profiler window, then any counters you’ve created don’t appear in the Available Counters pane when you load the Profiler Module Editor. To view custom counters, capture or load some data that has your emitted counters in with the Profiler, and reopen the Profiler Module Editor.

Creating Profiler modules in code
To create a Profiler module via code, you must create a new ProfilerModule script and define the module’s properties including the counters it displays, its name, and its icon.
To define a Profiler module, your script must do the following:
-
Define a class derived from
ProfilerModulein your project or package. In the following example, the class is calledTankEffectsProfilerModule:public class TankEffectsProfilerModule : ProfilerModule -
Assign the
[ProfilerModuleMetadata]attribute to this class and specify the module’s display name in the attribute’s argument. In the following example, the display name is “Tank Effects”:[ProfilerModuleMetadata("Tank Effects")] -
Implement a constructor that has no parameter, and pass a list of chart counter descriptions to the base constructor. In the following example, the constructor with no parameter is
TankEffectsProfilerModule(), the list of chart counter descriptors isk_Counters, and the base constructor isbase:static readonly ProfilerCounterDescriptor[] k_Counters = new ProfilerCounterDescriptor[] { new ProfilerCounterDescriptor(GameStatistics.TankTrailParticleCountName, GameStatistics.TanksCategory), new ProfilerCounterDescriptor(GameStatistics.ShellExplosionParticleCountName, GameStatistics.TanksCategory), new ProfilerCounterDescriptor(GameStatistics.TankExplosionParticleCountName, GameStatistics.TanksCategory), }; public TankEffectsProfilerModule() : base(k_Counters) { }
Displaying a custom Profile module in the Profiler window
When you define your own Profiler module, the Profiler window automatically detects it. To view data in your Profiler module in the Profiler window:
- Connect the Profiler to your application. For more information, refer to Profiling your application.
- Run your application.
You can also run the Profiler when your application is in Play mode. However, if you profile an application in Play mode, the Profiler displays data that is not representative of how your application runs when you build it on a hardware device.