Physics Profiler module
The Physics ProfilerA window that helps you to optimize your game. It shows how much time is spent in the various areas of your game. For example, it can report the percentage of time spent rendering, animating or in your game logic. More info
See in Glossary module displays information about the physics that the physics engineA system that simulates aspects of physical systems so that objects can accelerate correctly and be affected by collisions, gravity and other forces. More info
See in Glossary has processed in your SceneA Scene contains the environments and menus of your game. Think of each unique Scene file as a unique level. In each Scene, you place your environments, obstacles, and decorations, essentially designing and building your game in pieces. More info
See in Glossary. This information can help you diagnose and resolve performance issues or unexpected discrepancies related to the physics in your Scene.
For more information on debugging physics in your application, see the documentation on the Physics Debug Visualization.

Chart categories and module details pane
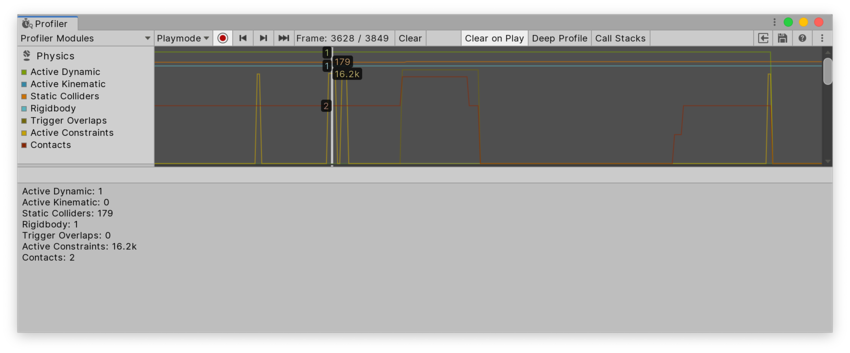
The Physics Profiler module’s chart tracks the time your application spends on physics. The timings are divided into seven categories. To change the order of the categories in the chart, you can drag and drop them in the chart’s legend. You can also click a category’s colored legend to toggle its display.
When you click on the chart, you can see the exact numerical values of each chart category in the module details pane below the chart.
| Chart | Function |
|---|---|
| Active Dynamic | The number of active non-Kinematic Rigidbody components. An active Rigidbody is one that isn’t sleeping. |
| Active Kinematic | The number of active Kinematic Rigidbody components. A Kinematic Rigidbody is active when MovePosition or MoveRotation is called in a frame, and remains active in the next frame. Note: Unity might process Kinematic Rigidbody components that have joints attached multiple times per frame, and this contributes to the value displayed. |
| Static Colliders | The number of Collider components on GameObjects that don’t have Rigidbody components attached to the GameObjects or their parent GameObjects. Collider components on GameObjects or parent GameObjects that have Rigidbody components do not count as Static Colliders. These are called Compound Colliders. Compound Colliders arrange multiple Colliders of a body in a convenient way, rather than having all of the Colliders on the same GameObject as the Rigidbody component. |
| Rigidbody | The number of Rigidbody components processed by the physics engine, irrespective of the components’ sleeping state. |
| Trigger Overlaps | The number of overlapping triggers (counted in pairs). |
| Active Constraints | The number of primitive constraints the physics engine has processed. Constraints are used as a building block of JointsA physics component allowing a dynamic connection between rigidbodies, usually allowing some degree of movement such as a hinge. More info See in Glossary as well as collisionA collision occurs when the physics engine detects that the colliders of two GameObjects make contact or overlap, when at least one has a rigidbody component and is in motion. More info See in Glossary response. For example, restricting a linear or rotational degree of freedom of a ConfigurableJoint involves a primitive constraint per each restriction. |
| Contacts | The total number of contact pairs between all Colliders in the Scene, including the amount of trigger overlap pairs. A contact is a pair of Colliders that either touch or overlap. Note: Unity creates contact pairs per ColliderAn invisible shape that is used to handle physical collisions for an object. A collider doesn’t need to be exactly the same shape as the object’s mesh - a rough approximation is often more efficient and indistinguishable in gameplay. More info See in Glossary pair once the distance between them is below a certain user configurable limit. As such, you might see contacts generated for Rigidbody components that are not yet touching or overlapping. See documentation on Collider.contactOffset and ContactPoint.separation for more details. |
The numbers displayed in the Profiler might not correspond to the exact number of GameObjectsThe fundamental object in Unity scenes, which can represent characters, props, scenery, cameras, waypoints, and more. A GameObject’s functionality is defined by the Components attached to it. More info
See in Glossary with physics components in your Scene. This is because Unity processes some physics components at a different rate depending on which other components affect it (for example, an attached Joint component). To calculate the exact number of GameObjects with specific physics components attached, you must write a custom script with the FindObjectsOfType function.
The Physics Profiler module does not show the number of sleeping Rigidbody components. These are components which do not engage with the physics engine, and are therefore not processed by the Profiler. For more information on sleeping Rigidbody components, see the documentation on RigidbodyA component that allows a GameObject to be affected by simulated gravity and other forces. More info
See in Glossary.
Using the Physics Profiler to understand performance issues
The physics simulation runs on a separate fixed frequency update cycle from the main logic’s update loop, and can only advance time via a Time.fixedDeltaTime per call. This is similar to the difference between Update and FixedUpdate. For more information on this, see the documentation on the Time window.
When a heavy logics or graphics frame takes a long amount of time, the Profiler has to call the physics simulation multiple times per frame. This means that an already resource-intensive frame takes even more time and resources. This might cause the physics simulation to temporarily stop according to the Maximum Allowed Timestep value, which you can set in the Project Settings window (menu: Edit > Project Settings > Time)
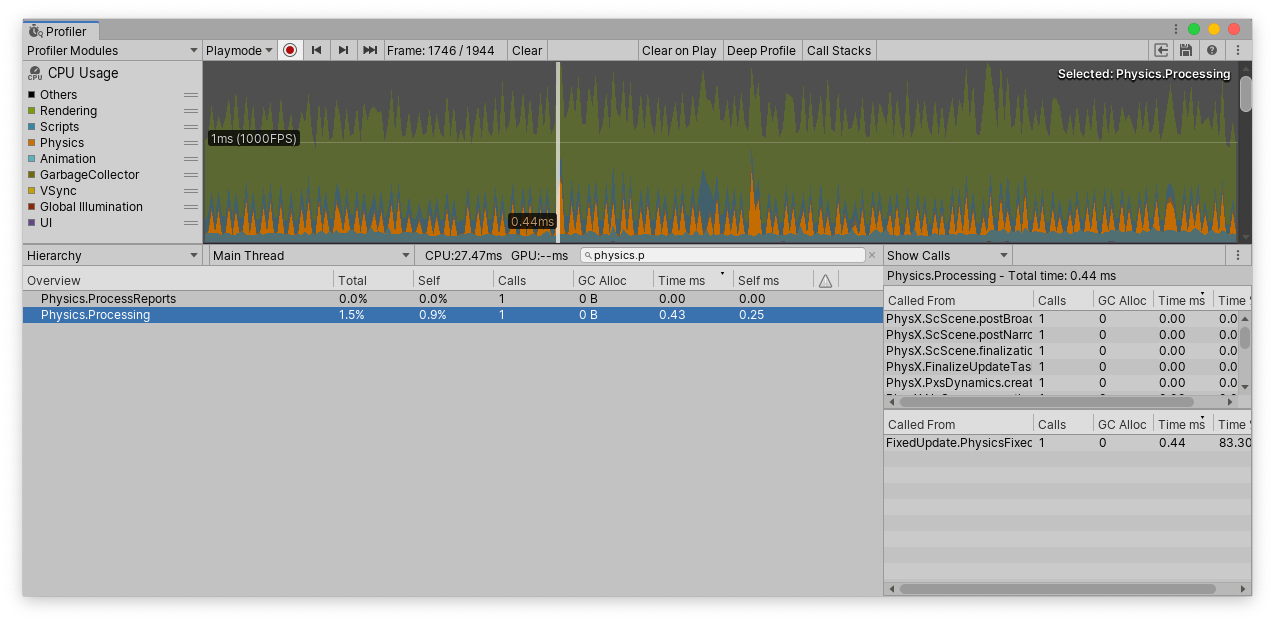
To detect this in your Project, select the CPU Usage Profiler module and check the number of calls for Physics.Processing or Physics.Simulate in the Overview section in the Hierarchy view.

In this example image, the value of 1 in the Calls column indicates that the physics simulation was called one time over the last logical frame.
A call count close to 10 might indicate an issue. As a first solution, reduce the frequency of the physics simulation, and if the issue continues, check what might have caused the heavy frame before the physics engine had to use a lot of simulation calls to catch up with the game time. Sometimes, a heavy graphics frame might cause more physics simulation calls later on in a Scene.
For more detailed information about the physics simulation in your Scene, select the search box at the top of the module details pane, search for Physics.Processing, and then select Show Calls from the dropdown at the top right of the pane. This displays the names of the physics engine tasks that run to update your Scene. The two most common names you’re likely to see are:
- Pxs: short for ‘PhysX solver’, which are physics engine tasks that joints require as well as resolving contacts for overlapping Rigidbodies.
-
ScScene: used for tasks that update the Scene, run the broad phase and narrow phase, and integrate Rigidbodies (moving them in space due to forces and impulses). For more information, see Steven M. LaValle’s work on Planning Algorithms for a definition on two-phase collision detectionAn automatic process performed by Unity which determines whether a moving GameObject with a rigidbody and collider component has come into contact with any other colliders. More info
See in Glossary phases.