Adding profiler markers to your code
Add profiler markersPlaced in code to describe a CPU or GPU event that is then displayed in the Unity Profiler window. Added to Unity code by default, or you can use ProfilerMarker API to add your own custom markers. More info
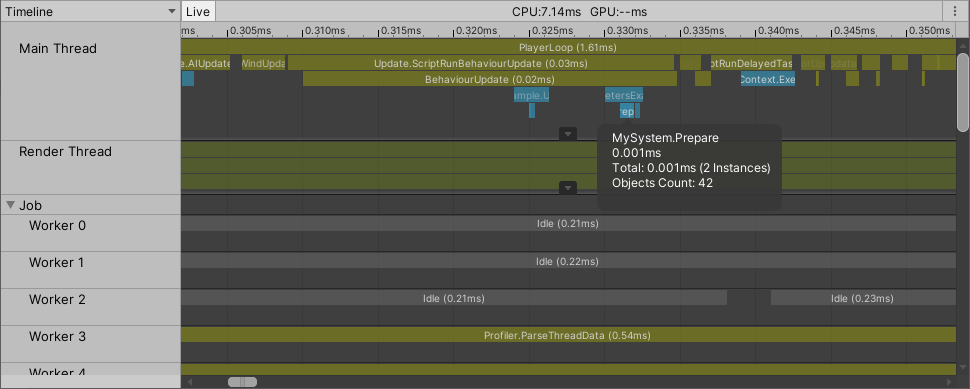
See in Glossary to your code to view the samples that ProfilerMarker.Begin, ProfilerMarker.End, or ProfilerMarker.Auto generates in the Timeline View and Hierarchy View of the CPU Usage module in the Profiler window:


Prerequisites
Some examples use the Profiling Core package, which you must install before you start. The Unity Profiling Core package isn’t discoverable in the Package Manager UI(User Interface) Allows a user to interact with your application. Unity currently supports three UI systems. More info
See in Glossary because it’s a core package. To install the package, add it by its name, which is com.unity.profiling.core.
Marking up your code
To use the ProfilerMarker API, place the code you want to profile between calls to ProfilerMarker.Begin and ProfilerMarker.End. For example:
using UnityEngine;
using Unity.Profiling;

public class ProfilerMarkerExample
{
    static readonly ProfilerMarker k_MyCodeMarker = new ProfilerMarker("My Code");

    void Update() {
        k_MyCodeMarker.Begin();
        Debug.Log("This code is being profiled");
        k_MyCodeMarker.End();
    }
}
Note: Avoid using the / character in a profilerA window that helps you to optimize your game. It shows how much time is spent in the various areas of your game. For example, it can report the percentage of time spent rendering, animating, or in your game logic. More info
See in Glossary marker’s name as this makes the Profiler window unable to highlight the marker in the CPU Profiler module’s charts view.
Make sure that the code in between the Begin and End calls doesn’t exit the scope before End is called. If the code exits the scope before End is called, an error message is logged to the Console. To avoid having to call End before every return, use Auto so that the sample is ended automatically on leaving the scope. For more information, refer to the section in this documentation on Automatically close profiler marker code blocks.
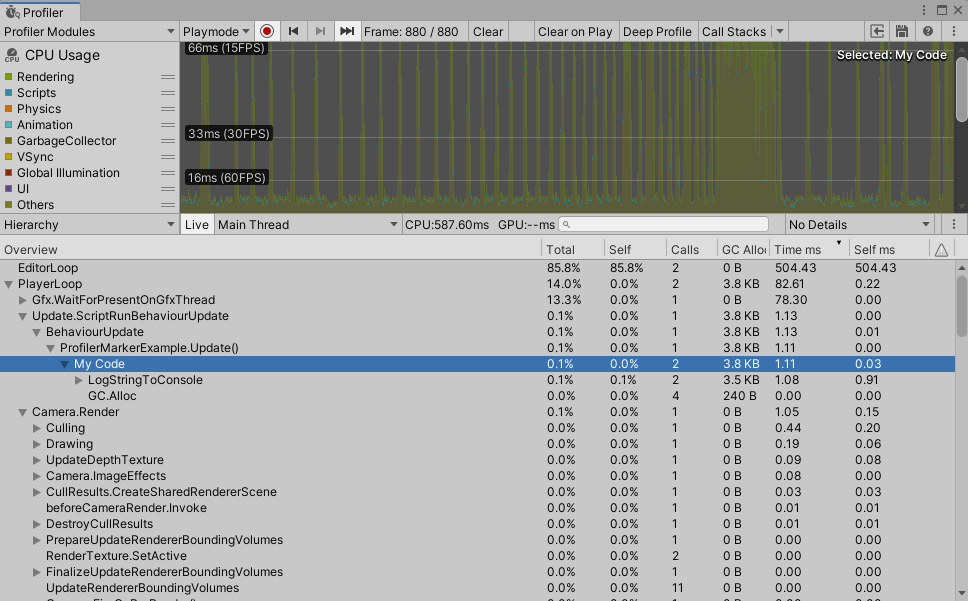
Unity records and reports the profiled code block’s execution time to the Profiler, and displays it in the CPU Profiler module without the need to use Deep Profiling. It displays it as a new entry in the Hierarchy View of the CPU Profiler module, as follows:

Automatically close profiler marker code blocks
Use ProfilerMarker.Auto to ensure that ProfilerMarker.End is automatically called at the end of the code block. The following calls are equivalent:
using Unity.Profiling;

public class MySystemClass
{
    static readonly ProfilerMarker k_UpdatePerfMarker = new ProfilerMarker("MySystem.Update");

    public void Update()
    {
        k_UpdatePerfMarker.Begin();
        // ...
        k_UpdatePerfMarker.End();

        using (k_UpdatePerfMarker.Auto())
        {
            // ...
        }
    }
}
Unlike the Begin() and End() calls, Unity can’t compile out the ProfilerMarker.Auto call in non-development (Release) builds. It will however instead return null, which only adds minimal overhead.
You can also use ProfilerMarker.Auto with a using var and the End call happens automatically once the current scope ends. This approach minimizes the amount of code you need to change when you add a ProfilerMarker instance to your code:
using Unity.Profiling;

public class MySystemClass
{
    static readonly ProfilerMarker k_UpdatePerfMarker = new ProfilerMarker("MySystem.Update");

    public void Update()
    {
        using var _ = k_UpdatePerfMarker.Auto();
        // ...
    }
}
Note: Any async await and any yield calls within an area marked up with ProfilerMarker’s aren’t supported and log an error message in the Console, even if you use Auto.
Adding integer or floating point parameters to samples
Sometimes you might want to add context to your code samples to identify specific conditions in which the code runs for a long time.
For example, if your system carries out simulations of objects, you can pass the number of objects with a Profiler sampleA set of data associated with a Profiler marker, that the Profiler has recorded and collected.
See in Glossary. If the Profiler returns an abnormal number along with a long sample duration, that might mean you have to use another thread for simulation, split the CPU work across multiple frames (timeslicing), or adjust your application’s design to prevent frame drops.
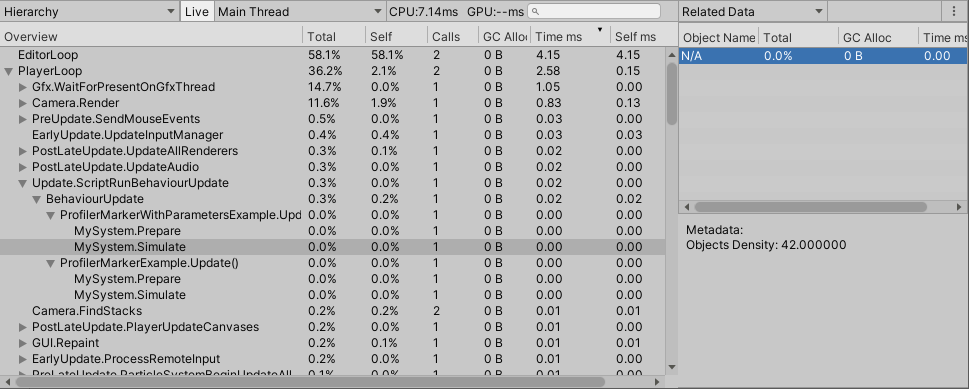
ProfilerMarker supports up to three numeric parameters: ProfilerMarker<TP1>, ProfilerMarker<TP1, TP2> and ProfilerMarker<TP1, TP2, TP3>:
using Unity.Profiling;

public class MySystemClass
{
  static readonly ProfilerMarker<int> k_PreparePerfMarker = new ProfilerMarker<int>("MySystem.Prepare", "Objects Count");
  static readonly ProfilerMarker<float> k_SimulatePerfMarker = new ProfilerMarker<float>(ProfilerCategory.Scripts, "MySystem.Simulate", "Objects Density");

  public void Update(int objectsCount)
  {
    k_PreparePerfMarker.Begin(objectsCount);
    // ...
    k_PreparePerfMarker.End();

    using (k_SimulatePerfMarker.Auto(objectsCount * 1.0f))
    {
      // ...
    }
  }
}
Adding string parameters to samples
The ProfilerMarker API supports adding string parameters to your profiler markers. A string parameter can be useful if you want to display the name of the level or file when your application loads level or data files. Use ProfilerMarkerExtension methods to pass a string parameter along with a Profiler sample:
using Unity.Profiling;

public class MySystemClass
{
  static readonly ProfilerMarker k_PreparePerfMarker = new ProfilerMarker("MySystem.Prepare");

  public void Prepare(string path)
  {
    k_PreparePerfMarker.Begin(path);
    // ...
    k_PreparePerfMarker.End();
  }
}