Adding profiling information to your code introduction
By default, the Profiler window displays information about Unity’s native code. It uses built-in profiler markers to organize and divide up the performance data it collects.
You can add profilerA window that helps you to optimize your game. It shows how much time is spent in the various areas of your game. For example, it can report the percentage of time spent rendering, animating, or in your game logic. More info
See in Glossary markers to your own code to make timings spent in these areas visible in the Profiler window with the ProfilerMarker API.
You can also add Profiler countersPlaced in code with the ProfilerCounter API to track metrics, such as the number of enemies spawned in your game. More info
See in Glossary to your code to collect data for metrics in your application, and use custom profiler modules to display this data. This is useful if you want to track performance changes in your application. Adding profiler counters to your code speeds up the investigation of performance issues because you can use the information from your counters in conjunction with Unity’s built-in counters and instrumentation data.
To add counters and markers with metadata to your code, you need to use the Unity Profiling Core package.
Important: The Unity Profiling Core package isn’t discoverable in the Package Manager UI(User Interface) Allows a user to interact with your application. Unity currently supports three UI systems. More info
See in Glossary because it’s a core package. To install the package, add it by name, which is com.unity.profiling.core.
Profiler markers
You can use the ProfilerMarker API to mark up resource-intensive script code blocks and make them visible in the Unity Profiler, or use the ProfilerMarker<TP1> API in the Unity Profiling Core package to add extra metadata to each sample it produces.
This can be useful because the built-in Unity Profiler doesn’t profile all method calls. The alternative is to use deep profiling, but this causes a large overhead that significantly slows down your application execution and skews the results. Using ProfilerMarker is a more efficient way of marking up your code.
ProfilerMarker represents a named Profiler handle and is the most efficient way of profiling your code. You can use it in any of your application’s C# code.
Profiler markers have no overhead when Unity deploys them in a non-development build, so you can mark up as many samples as you like.
Unity marks Begin and End methods with ConditionalAttribute and conditionally compiles them, so they have zero execution overhead in non-development builds. While Auto methods are not entirely compiled out in non-development builds, they are conditionally compiled to just return null, making their overhead negligible. The profiler markerPlaced in code to describe a CPU or GPU event that is then displayed in the Unity Profiler window. Added to Unity code by default, or you can use ProfilerMarker API to add your own custom markers. More info
See in Glossary’s field is present in release builds and takes up memory equivalent to its IntPtr, which is 8 bytes.
The ProfilerRecorder API also uses profiler markers to capture performance data. During development in the Unity Editor and in Development Players, you can use the API to get a performance overview of the different parts of your code and to identify performance issues.
Profiler counters
To display custom metrics in the Unity profiler, use the ProfilerCounter API in the Unity Profiling Core package. The Profiler can display data from ProfilerCounter or ProfilerCounterValue.
Unity groups Profiler counters into categories based on the type of work the counters profile, for example, Rendering, Scripting, or Animation. You can assign a custom Profiler counter to any of Unity’s profiling categories. For a full list of available Profiler categoriesIdentifies the workload data for a Unity subsystem (for example, Rendering, Scripting and Animation categories). Unity applies color-coding to categories to visually distinguish between the types of data in the Profiler window.
See in Glossary, refer to ProfilerCategory.
You can use the ProfilerCounter or ProfilerCounterValue API to track metrics of your application and make them visible in the Unity Profiler or in other code. If you’re an Asset StoreA growing library of free and commercial assets created by Unity and members of the community. Offers a wide variety of assets, from textures, models and animations to whole project examples, tutorials and Editor extensions. More info
See in Glossary package developer, you can add Profiler counters to your code to help other developers understand important performance characteristics of your system, and they can use this information for optimization or budgeting tooling.
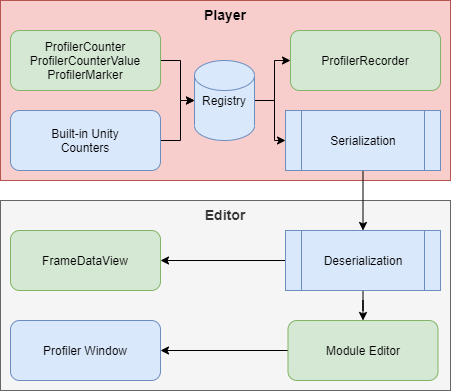
The following diagram displays a high level overview of the Profiler counters data flow:

The ProfilerRecorder API retrieves Profiler counter data in your application code, and the RawFrameDataView or HierarchyFrameDataView APIs get the Profiler counter data in the Editor code. You can visualize this counter data in the Profiler window by configuring a custom Profiler module in the Module Editor.
ProfilerCounter and ProfilerCounterValue support the following types:
- int
- long
- float
- double