- Unity User Manual (2019.2)
- 在 Unity 中操作
- 高级开发
- 性能分析器概述
- UI 性能分析器 (UI Profiler)
UI 性能分析器 (UI Profiler)
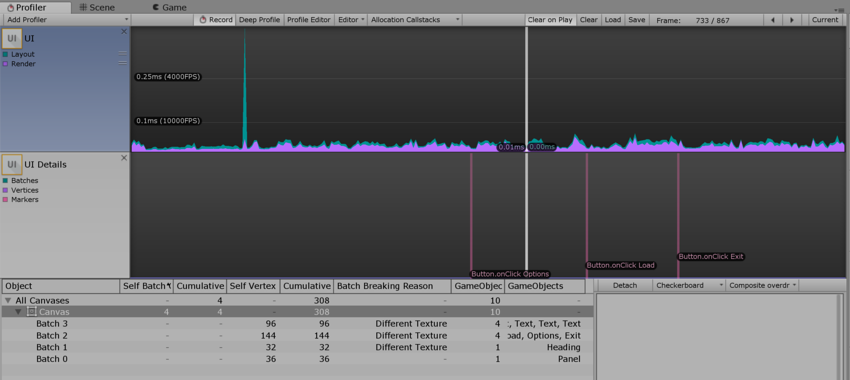
The UI Profiler is a profiler module that provides information on in-game UI.
To access it open the Profiler window and go to Add Profiler > UI and UI Details.

Use this feature to understand how Unity handles UI batching for your application, including why and how objects are batched. You can also use the profiler to find out which part of the UI is responsible for slow performance, or to preview the UI (or part of it) while scrubbing the timeline.
Note that the Profiler is resource intensive and might create a performance overhead.
设置
The UI Details chart has a Markers group that you can toggle on and off, similar to the CPU Profiler. The preview panel has a Detach button and two drop-down menus.
Markers 开关在 UI Details 图表上显示或隐藏事件标记。
Detach 在单独的窗口中弹出预览内容。
The two drop-down menus allow you to choose the preview background (black, white, or checkerboard) and the preview type (original render, overdraw, or composite overdraw).
有用的注意事项
标记可能会让人眼花缭乱,具体取决于所分析的用例。在需要时隐藏或显示标记有助于提高图表的可读性。
为了更清晰可见,可根据要预览的 UI 选择预览背景。例如,白色背景上的白色 UI 不易辨识,因此可以更改。
将预览内容分离出来有助于更好管理屏幕空间。
过度绘制和复合过度绘制用于确定 UI 的哪些部分是无用的。
定义
Marker: Unity records markers when the user interacts with the UI (for example, a button click, or a slider value change) and then draws them as vertical lines and labels on the chart.
Batch: the UI system batches draw calls where possible.
There are many reasons that Unity might be unable to batch objects together:
Not Coplanar With Canvas: The batching needs the object’s rect transform to be coplanar (unrotated) with the canvas.
CanvasInjectionIndex: A CanvasGroup component is present and forces a new batch, ie. when displaying the drop down list of a combo box on top of the rest.
Different Material Instance, Rect clipping, Texture, A8TextureUsage: Only objects with identical materials, masking, textures, texture alpha channel usage can be batched together.
提示
Treeview rows have a context menu with a “find matching object in scene” entry, which you can also trigger by double clicking on a row.
2017–05–17 页面已发布
Unity 2017.1 中的新功能 NewIn20171