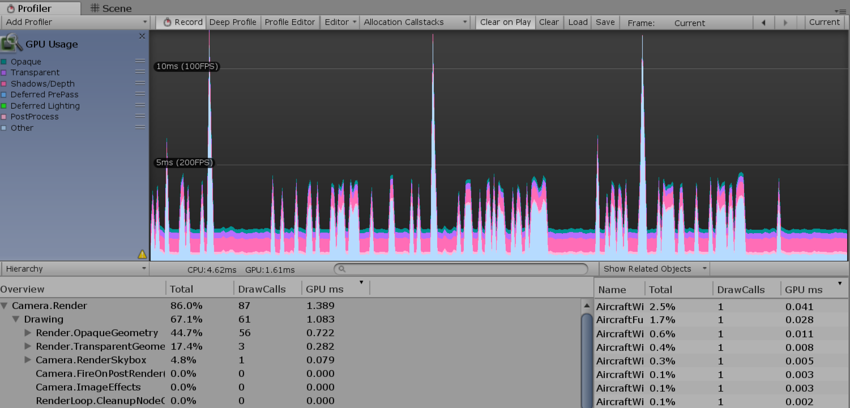
GPU Profiler

The GPU Usage Profiler displays where GPU time is spent in your game. When you select this Profiler, the lower pane displays hierarchical time data for the selected frame. Select an item from the Hierarchy to see a breakdown of contributions in the right-hand panel. See documentation on the Profiler window to learn more about the information in the Profiler.
Note that GPU profiling is disabled when Graphics Jobs (Experimental) is enabled in the Player settings. See documentation on Standalone Player settings for more information. On macOS, GPU profiling is only available under OSX 10.9 Mavericks and later versions.
Remote profiling support
| Platform | Graphics API | Status |
|---|---|---|
| Windows | D3D9, D3D11, D3D12, OpenGL core, OpenGL ES 2.0, OpenGL ES 3.x, Vulkan | Supported. |
| Mac OS X | OpenGL core | Supported. |
| Metal | Not available. Use XCode’s GPU Frame Debugger UI instead. | |
| Linux | OpenGL core, Vulkan | Supported. |
| PlayStation 4 | libgnm | Supported (an alternative is Razor). |
| Xbox One | D3D11 | Supported (an alternative is PIX). |
| WebGL | WebGL 1.0 and WebGL 2.0 | Not available. |
| Android | OpenGL ES 2.0, OpenGL ES 3.x | Supported only on devices running NVIDIA or Intel GPUs. |
| Vulkan | Supported | |
| iOS, tvOS | Metal, OpenGL ES 2.0, OpenGL ES 3.0 | Not available. Use XCode’s GPU Frame Debugger UI instead. |
| Tizen | OpenGL ES 2.0 | Not available. |
Profiling within the Unity Editor
The Editor supports profiling on Windows with Direct3D 9 and Direct3D 11 APIs only. This has both advantages and disadvantages: it is convenient for quick profiling, because it means you don’t need to build the Player; however, the Profiler is affected by the overhead of running the Unity Editor, which can make the profiling results less accurate.
2017–11–21 Page published with limited editorial review
Removed Samsung TV support.