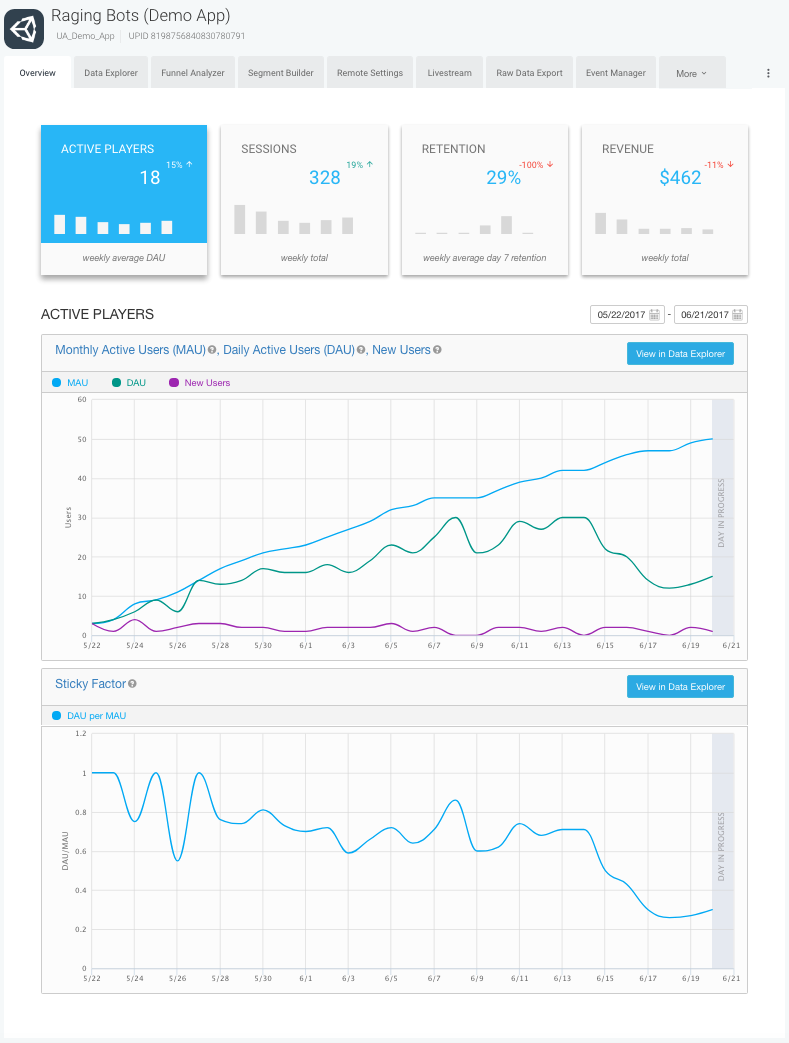
概要ページ
Unity Analytics ダッシュボードの概要ページは、多くの一般的に使用される指標やキーパフォーマンスの指針を追跡する既定のチャートを提供します。概要ページは以下のグラフを表示します。
| Active Players | Shows how many players start to play your game as well as return to it over time. |
| Sessions | Shows how often and how long the average player plays your game each day. |
| Retention | Shows the percentage of players who return to the game at significant intervals. |
| Revenue | Shows reported, verified In-App Purchase (IAP) and Unity Ads revenue. |

これらのセクションに表示される各グラフに対し、表示する日付範囲を選択できます。 また、データエクスプローラーに表示 ボタンをクリックすると、レポートデータを選択、書式設定、分析するためのさらに多くのオプションがある データエクスプローラー にレポートを表示できます。
概要ページやその他の Analytics ダッシュボードで使用される指標についての詳細は、Aalytics の指標、セグメント、用語 参照してください。
- 2017–08–21 編集レビュー を行ってパブリッシュされたページ
- Unity 2017.1 の新機能
Copyright © 2017 Unity Technologies. Publication 2017.1