Asset Loading Profiler module
The Asset Loading ProfilerA window that helps you to optimize your game. It shows how much time is spent in the various areas of your game. For example, it can report the percentage of time spent rendering, animating, or in your game logic. More info
See in Glossary module displays information about how your application loads assets, including a breakdown of read operations by area. The details pane provides an insight into each of the asset loading markers captured during the profile. You can use this information to find out how efficiently your application loads assets, and to identify any specific issues.
To open the Profiler window, go to menu: Window > Analysis > Profiler.
This module isn’t enabled by default. To enable the Asset Loading Profiler module, open the Profiler window, select the Profiler Modules dropdown menu, and toggle the Asset Loading checkbox.
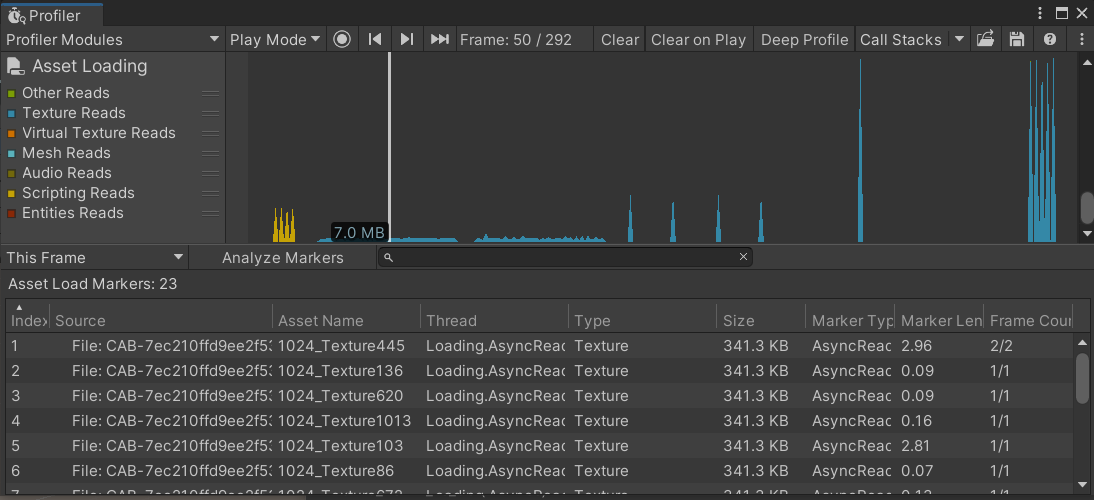
Chart categories
The Asset Loading Profiler module’s chart is divided into different categories. To change the order of the categories in the chart, drag them in the chart’s legend. You can also click a category’s colored legend to toggle its display. For more information on how to use the Profiler window, see Getting started with the Profiler window.
| Chart | Description |
|---|---|
| Other Reads | The number of bytes requested from the AsyncReadManager for an unspecified subsystem. |
| Texture Reads | The number of bytes requested from the AsyncReadManager for a texture load. |
| Virtual Texture Reads | The number of bytes requested from the AsyncReadManager for Virtual Texturing. |
| Mesh Reads | The number of bytes requested from the AsyncReadManager for a meshThe main graphics primitive of Unity. Meshes make up a large part of your 3D worlds. Unity supports triangulated or Quadrangulated polygon meshes. Nurbs, Nurms, Subdiv surfaces must be converted to polygons. More info See in Glossary load. |
| Audio Reads | The number of bytes requested from the AsyncReadManager for an audio load. |
| Scripting Reads | The number of bytes requested from the AsyncReadManager via the scripting API. |
| Entities Reads | The number of bytes requested from the AsyncReadManager by scriptsA piece of code that allows you to create your own Components, trigger game events, modify Component properties over time and respond to user input in any way you like. More info See in Glossary in the Entities package. |
Module details pane
The Asset Loading Profiler module doesn’t populate the details pane automatically. To populate the view with data, select the Analyze Markers button at the top of the details pane.
Then, when you select a frame in the Asset Loading Profiler module, the module details pane displays detailed information about how and when Unity loaded assets during the capture. This module can display information for either a single selected frame, or for all frames in the capture. Use the dropdown menu at the top-left of the details pane to choose between a single frame or all frames.
The Asset Markers view displays selected markers related to asset loading during the capture. Some rows have child markers that create a hierarchy, which is initially contained within a single expandable row. Select the dropdown arrow next to the marker’s name to expand the row and display all child markers.
The below table explains all the possible columns that the Asset Markers view can display. Some of these columns are disabled by default. To enable or disable a column, right-click anywhere in the row that contains the column names to open the column toggles sub-menu. Select any of the column names in this menu to either enable or disable that column. You can enter text into the search bar next to the Analyze Markers button to filter the results based on the Source column.
| Heading | Description | Enabled by default |
|---|---|---|
| Index | An ID number that represents the order of execution of the asset loading markers. | Yes |
| Source | The origin of the asset. This can be either a file path, an AssetBundle name, or a SceneA Scene contains the environments and menus of your game. Think of each unique Scene file as a unique level. In each Scene, you place your environments, obstacles, and decorations, essentially designing and building your game in pieces. More info See in Glossary. To display the full source file path for an entry, hover over the entry name. |
Yes |
| Asset Name | The name of the asset, if applicable and available in the Profiler’s metadata for the marker. | Yes |
| Thread | The thread that this marker occurred on. | Yes |
| Type | The asset type. | Yes |
| Size | The size of the load recorded by this marker. Note: This size might not include child markers, depending on the marker type. |
Yes |
| Marker Type | The marker type recorded. | Yes |
| Marker Length (ms) | Total duration of this marker across all frames it spans in milliseconds. | Yes |
| Frame Count | Displays the index of the selected frame from the span of frames that the marker occupies. Also displays the total number of frames the marker spans. | Yes |
| Timestamp (ms) | The time this marker started, relative to the start of the Profiler capture. | No |
| First Frame Index | The frame this marker started on. | No |
| Last Frame Index | The frame this marker ended on. | No |
You can right-click on any of the asset loading markers to open a sub-menu with additional options to visualize that data differently. The available options are as follows:
| Property | Function |
|---|---|
| Show marker in timeline view | Opens this marker in the CPU Usage Profiler module. |
| Go to the first frame of this marker | Selects the frame in which the marker first appears in the chart. This option is disabled if the marker only appears on one frame. |
| Go to the last frame of this marker | Selects the frame in which this marker last appears in the chart. This option is disabled if the marker only appears on one frame. |
| Filter the view to this source | Populates the search bar with the contents of the Source column to filter the results. |
| Filter the view to this asset name | Populates the search bar with the contents of the Asset Name column to filter the results. This option is disabled if the Asset Name column is empty. |