Collect performance data on a target platform
Record performance data with the Unity ProfilerA window that helps you to optimize your game. It shows how much time is spent in the various areas of your game. For example, it can report the percentage of time spent rendering, animating, or in your game logic. More info
See in Glossary on a target platform.
You can record the performance of your application on your chosen release platform to discover realistic performance metrics about your application. The Profiler can connect to your application when it’s running on a target device in the following ways:
- Via the local network
- Directly via cable
- Via IP address
Note: The Web platform supports profiling only for projects built with Autoconnect Profiler enabled and doesn’t support connections via IP address. For background information, refer to Web performance considerations.
Connect your application to the Profiler
To connect your application to the Profiler:
- Open the Build Profiles window (menu: File > Build Profiles)
- Select your application’s target platform
- Enable the Development BuildA development build includes debug symbols and enables the Profiler. More info
See in Glossary setting - Optionally enable the Autoconnect Profiler setting to automatically connect to the Profiler
- Optionally enable Deep Profiling Support to use Deep Profiling
- Select Build and Run, and make sure your application is running on your target device.
- Open the Profiler window (menu: Window > Analysis > Profiler). If you enabled the Autoconnect Profiler setting, the Profiler automatically collects data.
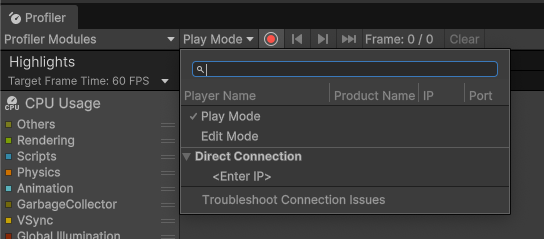
- If the Autoconnect Profiler setting is disabled, Select the Target Selection dropdown menu, next to the Record icon (⏺), and select the target player from the list.
- Select the Record icon

If you’ve enabled the Autoconnect Profiler setting, the Profiler collects data as soon as you open the Profiler window, as long as your application is running. Otherwise, the Profiler window collects data when you select the target from the Target Selection dropdown and select Record.
Connect to an application via IP address
To connect via IP address:
- Open the Profiler window (menu: Window > Analysis > Profiler)
- Select the Target Selection dropdown menu, next to the Record icon (⏺)
- Select <Enter IP> in the dropdown.
- Enter the IP address in the dialog that appears, and optionally the port of the player you want to connect to.
- Select the Record icon
Continuously collect data
To continuously collect data while your application runs:
- Open Player Settings (menu: Edit > Project Settings > Player)
- Under Resolution and Presentation, enable Run In Background