- Unity User Manual (2020.1)
- Platform development
- iOS
- iOS Player settings
- iOS Player settings - Debugging and crash reporting
iOS Player settings - Debugging and crash reporting
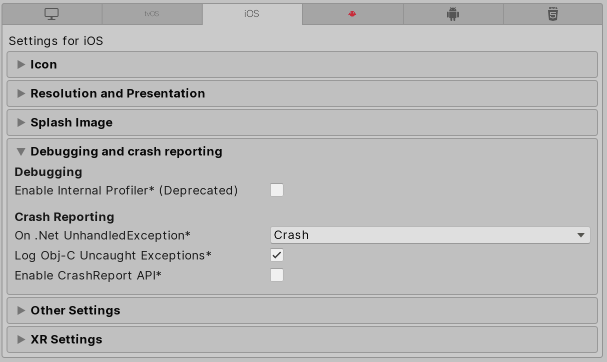
Use the Debugging and crash reporting settings to gather data about your app’s performance and troubleshoot crashes.

| Ajuste | Función: |
|---|---|
| Enable Internal Profiler (Deprecated) | This feature is deprecated and will be retired in a future version of Unity. Use the Profiler window instead (menu: Window > Analytics > Profiler). The Profiler collects application performance data and prints a report to the console. The report contains the number of milliseconds each Unity subsystem takes to execute on each frame, averaged across 30 frames. |
| On .Net UnhandledException | Select the action Unity takes when a .NET unhandled exception occurs. The options are Crash (the app crashes and generates a crash report, which users can submit to iTunes and developers can use to troubleshoot the crash), or Silent Exit (the application exits with no errors and doesn’t generate a crash report). |
| Log Obj-C Uncaught Exceptions | When you enable this action, Unity prints Objective-C Uncaught Exception information to the console. |
| Enable Crash Report API | Enables a custom crash reporter to capture crashes. You can use scripts to access crash logs via the CrashReport API. |
Copyright © 2020 Unity Technologies. Publication 2020.1