Funnels
Funnels help you track whether players make it through linear sequences in your game. A funnel reveals what percentage of your players make it through each step of the sequence as well as the sequence as a whole. Common sequences to track with a funnel include:
- First-time user experience — track how new players make it through your on-boarding sequence
- Game Progression — track how players progress through the major milestones in your game, such as level completion
- Purchase UI — uncover impediments to making a purchase
Funnels are based on Standard and Custom events. Unity Analytics evaluates each step in a funnel according to whether the defined standard or custom event has been dispatched with the correct parameter values. In order for users to enter and progress through a funnel, they must complete the funnel steps in the precise order those steps appear in the funnel.
Create funnels on your Analytics Dashboard.
*Important: Unity Analytics evaluates the rules defined in a funnel as it processes incoming data. Existing data is not re-evaluated when you create a new funnel. Only data received after you create a funnel appears in the Funnel Analyzer report.
Create a new funnel
Before creating a funnel, you should first:
- Add the necessary Standard or Custom Events to your game.
- Run your game so that at least one instance of each event is dispatched to the Unity Analytics system. You can perform this step while running your game in the Unity editor.
- Wait for Unity Analytics to process the events (about 8–16 hours).
After dispatching at least one instance of the Standard and Custom events that you want to include in the funnel, and waiting until those events are processed, follow these steps to create the funnel rules on the Analytics Dashboard:
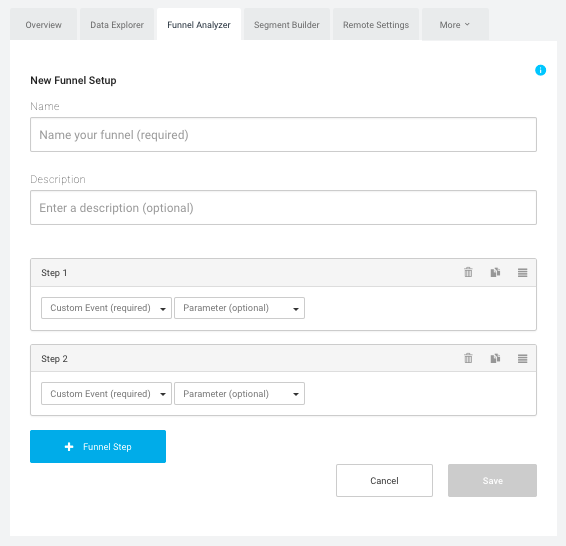
- On the Unity Analytics Dashboard, click the Funnel Analyzer tab.

- Enter a Name and, optionally, a Description for your funnel.
- For each step in the linear sequence of events you want to track and analyze:
- Click + Funnel Step. (The first two steps are created automatically, since a funnel always requires comparing at least two phases of progression.)
- Select the Standard or Custom Event name. Only events that have been dispatched by an instance of your game and processed are listed.
- Set rules for the Parameters (optional).
The parameters dispatched with an event must satisfy the rules you define in order for that player to successfully complete that step in the funnel. If you do not define parameter rules, simply dispatching the event completes the step.
- Click Save.
Note: After you’ve clicked Save, funnel steps cannot be modified. However, you can create a copy of the funnel and modify the steps of the copy. The reason for this restriction is that changing the rules of an existing funnel would invalidate any existing data included in that funnel.
Reading a Funnel Analyzer report
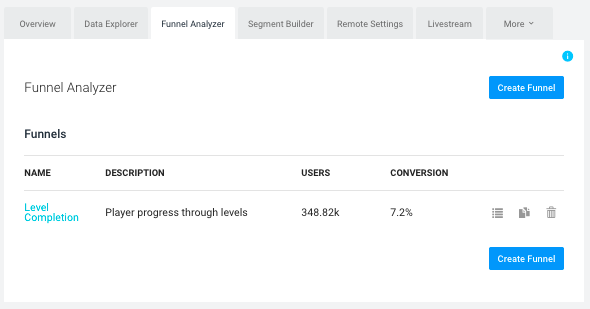
The Funnel Analyzer tab of your Analytics Dashboard lists the funnels that you have created.

Check the Members column to see how many players have entered the funnel. A Funnel Analyzer report has two sections: the Funnel chart and the Drilldown section, which provides more detailed information about the funnel data.
Funnel chart
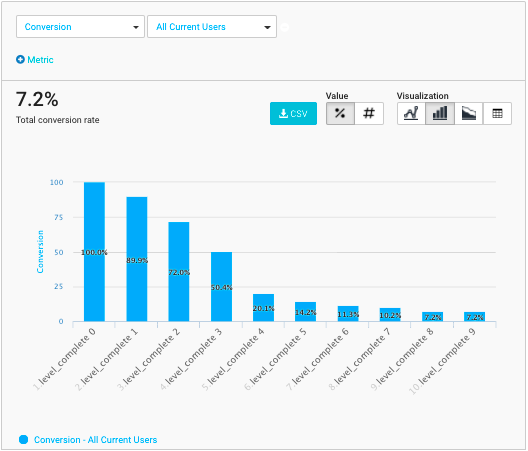
The Funnel chart provides an immediate overview of how players have progressed through the sequence of steps tracked by the funnel. Unexpected drop-offs between steps indicate good places to investigate game play, user interface, or other issues that block players from continuing to the next step.

The above example shows an example funnel based on the level_complete event. This example exhibits large drop offs in the early levels. The chart can’t tell you exactly what is wrong – the levels could be too hard, or they could be too easy – but it can reveal good places to look for game-play problems.
Drilldown Sections
Located below the Funnel chart, the Drilldown sections provide more detail about the players and data in the funnel. There are three types of drilldown section: Segments Overview, Funnel Detail, and Parameters Overview. Use the Drilldown Type drop-down list to choose a section.
Click the CSV button to download a comma-separated value file containing the funnel data including all the segments. (The data in this file is the same no matter which Drilldown Type you select.)
Segments Overview
The Segments Overview type displays a tabular form of the funnel chart.

You can select different segment categories in the Segment list to see how funnel performance compares across both standard segments and any custom segments you have defined. The drilldown table lists the percentage of your player population who have successfully completed the entire sequence after the segment name. The table lists the percentage who have moved from one step to the next after the player count for each step.
Funnel Detail
The Funnel Detail type compares consecutive steps in the funnel over time. Select two consecutive steps to compare using the Funnel Step list.

The Conversion plot on the graph shows the percentage of players who completed the first step who also completed the second step.
Parameters Overview
The Parameters Overview type displays the average values of any numeric parameters dispatched with the funnel step’s event. Use the Funnel Step to choose the step to view. Select a Segment to compare the values across segments.

- 2017–08–29 Page published with editorial review
- New feature in Unity 2017.1