Accessing memory counters in players
You can use the ProfilerRecorder API to access the Memory ProfilerA window that helps you to optimize your game. It shows how much time is spent in the various areas of your game. For example, it can report the percentage of time spent rendering, animating, or in your game logic. More info
See in Glossary module’s counters in a player.
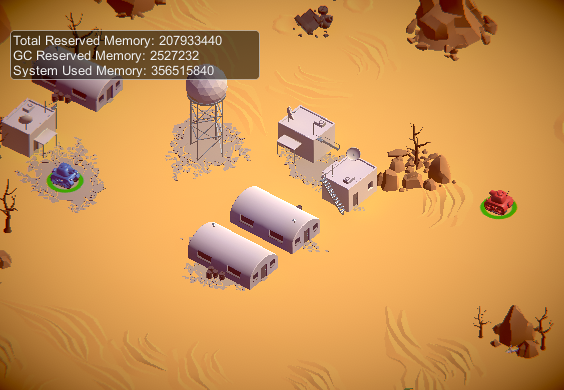
The following example contains a simple script that collects Total Reserved Memory, GC Reserved Memory and System Used Memory metrics, and displays those as a GUI.TextArea. The Memory Profiler module information belongs to the ProfilerCategory.Memory Profiler categoryIdentifies the workload data for a Unity subsystem (for example, Rendering, Scripting and Animation categories). Unity applies color-coding to categories to visually distinguish between the types of data in the Profiler window.
See in Glossary.
using System.Text;
using Unity.Profiling;
using UnityEngine;

public class MemoryStatsScript : MonoBehaviour
{
    string statsText;
    ProfilerRecorder totalReservedMemoryRecorder;
    ProfilerRecorder gcReservedMemoryRecorder;
    ProfilerRecorder systemUsedMemoryRecorder;

    void OnEnable()
    {
        totalReservedMemoryRecorder = ProfilerRecorder.StartNew(ProfilerCategory.Memory, "Total Reserved Memory");
        gcReservedMemoryRecorder = ProfilerRecorder.StartNew(ProfilerCategory.Memory, "GC Reserved Memory");
        systemUsedMemoryRecorder = ProfilerRecorder.StartNew(ProfilerCategory.Memory, "System Used Memory");
    }

    void OnDisable()
    {
        totalReservedMemoryRecorder.Dispose();
        gcReservedMemoryRecorder.Dispose();
        systemUsedMemoryRecorder.Dispose();
    }

    void Update()
    {
        var sb = new StringBuilder(500);
        if (totalReservedMemoryRecorder.Valid)
            sb.AppendLine($"Total Reserved Memory: {totalReservedMemoryRecorder.LastValue}");
        if (gcReservedMemoryRecorder.Valid)
            sb.AppendLine($"GC Reserved Memory: {gcReservedMemoryRecorder.LastValue}");
        if (systemUsedMemoryRecorder.Valid)
            sb.AppendLine($"System Used Memory: {systemUsedMemoryRecorder.LastValue}");
        statsText = sb.ToString();
    }

    void OnGUI()
    {
        GUI.TextArea(new Rect(10, 30, 250, 50), statsText);
    }
}
The following screenshot shows the result of adding the script to the Tanks! tutorial project.

This information is available in release players, as are the other high level counters available in the Memory Profiler module. If you want to view the selected memory counters in a custom module in the Profiler window, use the Profiler module editor to configure the chart.
For more information on adding profiler information to your code, refer to Adding profiling information to your code.