Unity Manual
- Unity 6 User Manual
- What's new in Unity
- Install and upgrade
- Install Unity
- Deploy Unity across your enterprise
- Enable Unity installation by standard users (Windows)
- Use Unity through web proxies
- Enable automatic proxy configuration
- Store credentials for automatic proxy configuration (Windows)
- Store credentials for automatic proxy configuration (macOS)
- Trusting the web proxy security certificate
- Use environment variables to identify your web proxy
- Create a command file to set environment variables and open applications
- Define exceptions on your web proxy
- Licenses and activation
- Upgrade Unity
- Packages and feature sets
- Unity's Package Manager
- How Unity works with packages
- Concepts
- Configuration
- Package Manager window
- Access the Package Manager window
- Navigation panel
- List panel
- Details panel
- Features (details panel)
- Finding packages and feature sets
- Add and remove UPM packages or feature sets
- Install a feature set from the Unity registry
- Install a UPM package from a registry
- Install a UPM package from the Asset Store
- Install a UPM package from a local folder
- Install a UPM package from a local tarball file
- Install a UPM package from a Git URL
- Install a UPM package by name
- Remove a UPM package from a project
- Switch to another version of a UPM package
- Add and remove asset packages
- Disable a built-in package
- Perform an action on multiple packages
- Finding package documentation
- Inspecting packages
- Scripting API for packages
- Scoped registries
- Resolution and conflict
- Project manifest
- Troubleshooting
- Packages
- Released packages
- 2D Animation
- 2D Aseprite Importer
- 2D Pixel Perfect
- 2D PSD Importer
- 2D SpriteShape
- 2D Tilemap Extras
- Adaptive Performance
- Addressables
- Addressables for Android
- Ads Mediation
- Advertisement Legacy
- AI Navigation
- Alembic
- Analytics
- Android Logcat
- Animation Rigging
- Apple ARKit XR Plugin
- Apple visionOS XR Plugin
- AR Foundation
- Asset Manager
- Authentication
- Behavior
- Build Automation
- Burst
- CCD Management
- Character Controller
- Cinemachine
- Cloud Code
- Cloud Diagnostics
- Cloud Save
- Cloud Services Apis
- Code Coverage
- Collections
- Dedicated Server
- Deployment
- Device Simulator Devices
- Economy
- Editor Coroutines
- Entities
- Entities Graphics
- FBX Exporter
- Friends
- Google ARCore XR Plugin
- Havok Physics for Unity
- In App Purchasing
- Input System
- iOS 14 Advertising Support
- JetBrains Rider Editor
- Leaderboards
- Live Capture
- Lobby
- Localization
- Magic Leap XR Plugin
- Matchmaker
- Mathematics
- Memory Profiler
- Microsoft GDK API
- Microsoft GDK Tools
- ML Agents
- Mobile Notifications
- Multiplay
- Multiplayer Play Mode
- Multiplayer Services
- Multiplayer Tools
- Multiplayer Widgets
- Muse Sprite
- Muse Texture
- Netcode for Entities
- Netcode for GameObjects
- Oculus XR Plugin
- OpenXR Plugin
- Performance testing API
- Player Accounts
- Polybrush
- PolySpatial Extensions
- PolySpatial visionOS
- Post Processing
- ProBuilder
- Profile Analyzer
- Push Notifications
- Python Scripting
- Recorder
- Relay
- Remote Config
- Scriptable Build Pipeline
- Sentis
- Sequences
- Services Tooling
- Splines
- Sysroot Base
- Sysroot Linux x64
- System Metrics Mali
- Terrain Tools
- Timeline
- Toolchain Linux x64
- Toolchain MacOS Arm64 Linux x64
- Toolchain MacOS Linux x64
- Toolchain Win Linux x64
- Toolchain WinArm64 Linux x64
- Tutorial Authoring Tools
- Tutorial Framework
- Unity Logging
- Unity OpenXR Meta
- Unity Physics
- Unity Profiling Core API
- Unity Transport
- User Generated Content
- User Generated Content Bridge
- User Reporting
- Version Control
- Visual Scripting
- Visual Studio Editor
- Vivox
- WebGL Publisher
- XR Hands
- XR Interaction Toolkit
- XR Plugin Management
- ZivaRT Player
- Release candidates
- Pre-release packages
- Core packages
- Built-in packages
- Accessibility
- AI
- AMD
- Android JNI
- Animation
- Asset Bundle
- Audio
- Cloth
- Director
- Image Conversion
- IMGUI
- JSONSerialize
- NVIDIA
- Particle System
- Physics
- Physics 2D
- Screen Capture
- Terrain
- Terrain Physics
- Tilemap
- UI
- UIElements
- Umbra
- Unity Web Request
- Unity Web Request Asset Bundle
- Unity Web Request Audio
- Unity Web Request Texture
- Unity Web Request WWW
- Vehicles
- Video
- VR
- Wind
- XR
- Experimental packages
- Packages by keywords
- Deprecated packages
- Released packages
- Creating custom packages
- Feature sets
- Unity's Package Manager
- Get started with Unity
- The Unity Editor
- Unity's interface
- The Project window
- The Scene view
- The Game view
- Device Simulator
- The Hierarchy window
- The Inspector window
- Editing properties
- The Toolbar
- The status bar
- The Background Tasks window
- Console window
- Additional windows
- Undo
- Search in the Editor
- Customizing your workspace
- Unity shortcuts
- Save your work
- Editor Features
- Unity Search
- Unity's interface
- Working in Unity
- Assets and media
- Asset workflow
- Importing assets
- Importing assets simultaneously
- Caching assets
- Introduction to Unity Accelerator
- Unity Accelerator requirements
- Install Unity Accelerator with the installer
- Install Unity Accelerator with Docker Hub
- Verify the Unity Accelerator version
- Configure Unity Accelerator in the Editor
- Stop and restart Unity Accelerator
- Monitor Unity Accelerator
- Use Unity Accelerator on the command line
- Mirror multiple Unity Accelerator instances
- Cache Server Project Settings reference
- Unity Accelerator Prometheus metrics reference
- Supported Asset Types
- Asset Metadata
- The Asset Database
- Reserved folder name reference
- Import Activity window
- Presets
- AssetBundles
- Scripting with Assets
- Asset packages
- Archives
- Optimizing assets
- Importing assets
- Unity's Asset Store
- Asset Store packages
- Publish to the Asset Store
- Creating your Publisher Account
- Creating a new package draft
- Deleting a package draft
- Uploading assets to your package
- Filling in the package details
- Submitting your package for approval
- Viewing the status of your Asset Store submissions
- Collecting revenue
- Providing support to your customers
- Adding tags to published packages
- Connecting your account to Google Analytics
- Promoting your Assets
- Refunding your customers
- Upgrading packages
- Deprecating your Assets
- Issuing vouchers
- Managing your publishing team
- Asset Store Publisher portal
- Verified Solutions
- Asset workflow
- Working with GameObjects
- Introduction to GameObjects
- GameObject fundamentals
- Primitive and placeholder objects
- Components
- Models
- Meshes
- Prefabs
- Constraints
- Working with scenes
- Cameras
- Introduction to cameras
- The camera view
- Using multiple cameras
- Changing resolution scale
- Excluding hidden objects with occlusion culling
- Occlusion culling
- Set up a scene for occlusion culling
- Set up multiple scenes for occlusion culling
- Cull moving GameObjects
- Create high-precision occlusion areas
- Control occlusion in areas with Occlusion Portals
- Occlusion Culling window reference
- Configure culling with the CullingGroup API
- Troubleshooting occlusion culling
- Simulating real-world cameras with Physical Cameras
- Camera output
- Cameras in URP
- Introduction to cameras in URP
- Camera render types in URP
- Multiple cameras in URP
- Camera render order in URP
- Motion vectors in URP
- Upscaling resolution in URP with Spatial-Temporal Post-Processing
- Access camera data with the Universal Additional Camera Data component in URP
- Camera Inspector windows reference for URP
- Cameras in the Built-In Render Pipeline
- Troubleshooting cameras
- Input
- 2D in Unity
- Introduction to 2D
- 2D game development
- 2D renderer sorting
- Sprites
- Image import as sprites
- Sprites sorting order
- Sprite Renderer
- Placeholder sprites
- Sprite editor
- Sorting groups
- Various image sizes without multiple assets
- Sprite masks
- Sprite atlas
- Sprite shape renderer
- Tilemaps in Unity
- Tilemaps
- Work with tilemaps
- Create a tilemap
- Hexagonal Tilemaps
- Isometric tilemaps in Unity
- Tilemap Collider 2D
- Tilemap component reference
- Tilemap Renderer component reference
- Tilemap Collider 2D component reference
- Troubleshoot mismatched Cell Layouts
- Tiles for tilemaps
- Tile palettes
- Create a Tile Palette
- Tile palette brushes
- Tile palette editor tools
- New tile palette properties reference
- Tile palette preferences reference
- Tile palette editor reference
- Grid component reference
- 2D Physics
- Rigidbody 2D
- Collider 2D
- Effectors 2D
- 2D joints
- Physics 2D Profiler
- Constant Force 2D reference
- Physics Material 2D reference
- 2D game development in URP
- 2D lighting in URP
- Types of 2D lights
- Set up the 2D Renderer asset in URP
- Prepare and upgrade sprites for 2D lighting in URP
- Enable 2D lighting with the Tilemap Renderer in URP
- Blend Modes in 2D lighting
- Create shadows with Shadow Caster 2D in URP
- Create a 2D sprite lit Shader Graph in URP
- Light a VFX Graph asset with 2D lights in URP
- Optimizing 2D lights
- 2D Renderer asset component reference for URP
- Light Blend Styles component reference for URP
- Precise pixel scaling and rotation via the Pixel Perfect Camera in URP
- 2D lighting in URP
- Troubleshooting
- Assets and media
- World building
- Sky
- Terrain
- Creating and editing Terrains
- Create Neighbor Terrains
- Terrain tools
- Terrain Layers
- Brushes
- Trees
- Grass and other details
- Working with Heightmaps
- Terrain Settings reference
- Using Terrain at runtime
- Terrain Tools package
- Multiplayer
- UI systems
- Comparison of UI systems in Unity
- UI Toolkit
- Get started with UI Toolkit
- UI Builder
- Structure UI
- The visual tree
- Structure UI with UXML
- Structure UI with C# scripts
- Custom controls
- Best practices for managing elements
- Encapsulate UXML documents with logic
- Visual elements reference
- BindableElement
- VisualElement
- BoundsField
- BoundsIntField
- Box
- Button
- ColorField
- CurveField
- DoubleField
- DropdownField
- EnumField
- EnumFlagsField
- FloatField
- Foldout
- GradientField
- GroupBox
- Hash128Field
- HelpBox
- IMGUIContainer
- Image
- InspectorElement
- IntegerField
- Label
- LayerField
- LayerMaskField
- LongField
- ListView
- MaskField
- MinMaxSlider
- MultiColumnListView
- MultiColumnTreeView
- ObjectField
- PopupWindow
- ProgressBar
- PropertyField
- RadioButton
- RadioButtonGroup
- RectField
- RectIntField
- RepeatButton
- RenderingLayerMaskField
- ScrollView
- Scroller
- Slider
- SliderInt
- Tab
- TabView
- TagField
- TextElement
- TextField
- TemplateContainer
- Toggle
- ToggleButtonGroup
- Toolbar
- ToolbarBreadcrumbs
- ToolbarButton
- ToolbarMenu
- ToolbarPopupSearchField
- ToolbarSearchField
- ToolbarSpacer
- ToolbarToggle
- TreeView
- TwoPaneSplitView
- UnsignedLongField
- UnsignedIntegerField
- Vector2Field
- Vector2IntField
- Vector3Field
- Vector3IntField
- Vector4Field
- Structure UI examples
- Create list and tree views
- Create a complex list view
- Create a list view runtime UI
- Wrap content inside a scroll view
- Create a tabbed menu
- Create a pop-up window
- Use Toggle to create a conditional UI
- Create a custom control with two attributes
- Create a slide toggle custom control
- Create a bindable custom control
- Create a custom style for a custom control
- Create a drag-and-drop list and tree views between windows
- Create an aspect ratio custom control
- Style UI
- UI Toolkit Debugger
- Control behavior with events
- UI Renderer
- Data binding
- Comparison of the binding systems
- Runtime data binding
- SerializedObject data binding
- Introduction to SerializedObject data binding
- Bindable elements reference
- Bindable data types and fields
- Binding system implementation details
- Binding examples
- Bind with binding path in C# script
- Bind without the binding path
- Bind with UXML and C# script
- Create a binding with the Inspector
- Bind to nested properties
- Bind to a UXML template
- Receive callbacks when a bound property changes
- Receive callbacks when any bound properties change
- Bind to a list with ListView
- Bind to a list without ListView
- Bind a custom control
- Bind a custom control to custom data type
- Support for Editor UI
- Support for runtime UI
- Work with text
- Examples
- Migration guides
- Unity UI
- Immediate Mode GUI (IMGUI)
- Animation
- Physics
- Built-in 3D Physics
- Character control
- Rigidbody physics
- Collision
- Joints
- Articulations
- Ragdoll physics
- Cloth
- Multi-scene physics
- Physics Debug window reference
- Physics Profiler module
- Built-in 3D Physics
- Lighting
- Introduction to lighting
- Light sources
- Direct and indirect lighting
- Lighting data
- Precalculating surface lighting with lightmaps
- Global illumination
- Baking lightmaps before runtime
- Creating lightmaps at runtime with Enlighten Realtime Global Illumination
- Configuring lightmapping
- Lightmap UVs
- Precalculating indirect light with Light Probes
- Save and load lighting settings with Lightmap Parameters Assets
- Shadows
- Reflections
- Lighting in URP
- Introduction to lighting in the Universal Render Pipeline
- Light limits in URP
- View and control a light from its perspective in URP
- Shadows in URP
- Reflections in URP
- Adaptive Probe Volumes (APV) in URP
- Introduction to Adaptive Probe Volumes
- Use Adaptive Probe Volumes
- Display Adaptive Probe Volumes
- Configure the size and density of Adaptive Probe Volumes
- Bake multiple scenes together with Baking Sets
- Changing lighting at runtime
- Optimize loading Adaptive Probe Volume data
- Troubleshooting Adaptive Probe Volumes
- Adaptive Probe Volume Inspector reference
- Adaptive Probe Volumes panel reference
- Probe Volumes Options Override reference
- Probe Adjustment Volume component reference
- Rendering Layers in URP
- Custom lighting in URP
- Universal Additional Light Data component in URP
- Light component Inspector window reference for URP
- Lighting in the Built-In Render Pipeline
- Per-pixel and per-vertex lights in the Built-In Render Pipeline
- Emit light from a GameObject in the Built-In Render Pipeline
- Create cookies in the Built-In Render Pipeline
- Customize how shaders contribute lightmap data in the Built-In Render Pipeline
- Shadows in the Built-In Render Pipeline
- Configure a GameObject to sample more Light Probes in the Built-In Render Pipeline
- Introduction to Light Probe Proxy Volumes in the Built-In Render Pipeline
- Set a GameObject to use a Light Probe Proxy Volume in the Built-In Render Pipeline
- Configure a Light Probe Proxy Volume in the Built-In Render Pipeline
- Light Probe Proxy Volume component reference for the Built-In Render Pipeline
- Add Light Probe Proxy Volume support to a custom shader in the Built-In Render Pipeline
- Blend Reflection Probes in the Built-In Render Pipeline
- Light component Inspector window reference for the Built-In-Render-Pipeline
- Optimize lighting in the Built-In Render Pipeline
- Lighting reference
- Materials and shaders
- Textures
- Get started with textures
- Import a texture
- 2D texture arrays
- Cubemaps
- 3D textures
- Rendering to a texture
- Playing video in Movie Textures
- Texture optimization
- Loading textures in the background
- Optimizing GPU texture memory with mipmap streaming
- Sparse Textures
- Streaming Virtual Texturing
- Streaming Virtual Texturing requirements and compatibility
- How Streaming Virtual Texturing works
- Enabling Streaming Virtual Texturing in your project
- Using Streaming Virtual Texturing in Shader Graph
- Cache Management for Virtual Texturing
- Marking textures as "Virtual Texturing Only"
- Virtual Texturing error material
- Virtual Texturing Profiler module
- Textures reference
- Texture Import Settings window reference
- Default texture Import Settings window reference
- Normal Map texture Import Settings window reference
- Editor GUI and Legacy GUI texture Import Settings window reference
- Sprite (2D and UI) texture Import Settings window reference
- Cubemap texture Import Settings window reference
- 3D texture preview reference
- Cursor texture Import Settings window reference
- Cookie texture Import Settings window reference
- Lightmap texture Import Settings window reference
- Lightmap texture Import Settings window reference
- Shadowmask texture Import Settings window reference
- Single Channel texture Import Settings window reference
- Movie Texture Inspector window reference
- Render Texture Inspector window reference
- Custom Render Texture Inspector window reference
- Shaders
- Introduction to shaders
- Prebuilt shaders
- Prebuilt shaders render pipeline compatibility reference
- Configuring material properties in prebuilt shaders
- Legacy prebuilt shaders
- Writing custom shaders
- Creating shaders with Shader Graph
- Writing shaders in code
- Introduction to writing shaders in code
- Shader object fundamentals
- Writing a custom shader in ShaderLab and HLSL
- Create a shader file
- Add a subshader in a custom shader
- Add a shader pass in a custom shader
- Include a shader pass with the UsePass command
- Writing HLSL shader programs
- Setting the render state on the GPU
- Enable conservative rasterization in a shader
- Set the culling mode in a shader
- Set the depth bias in a shader
- Set the depth clip mode in a shader
- Set the depth testing mode in a shader
- Disable writing to the depth buffer in a shader
- Check or write to the stencil buffer in a shader
- Set the blending mode in a shader
- Set the color channels the GPU renders to
- Reduce aliasing with AlphaToMask mode
- Group commands with the Category block
- Adding material properties to shaders
- Changing how shaders work via branching and keywords
- Branching in shaders
- Shader keywords
- Configure when and if Unity uses a shader
- Introduction to shader tags
- Add a shader tag to a SubShader or Pass
- Set a shader to require URP or HDRP
- Set a shader to require a graphics API or platform
- Set a shader to require a shader model or GPU feature
- Set a shader to require a package
- Set the render queue of a shader
- Set when Unity runs a shader pass via a LightMode tag
- Prioritize lower quality shaders with the LOD command
- Disable dynamic batching of a shader
- Get tag values in a script
- Troubleshooting package requirement definitions
- Compute shaders
- Optimize shaders
- Shaders in URP
- Shading models in URP
- Choose a prebuilt shader in URP
- Assign a shader to a material in URP
- Reduce shader variants in URP
- Writing custom shaders in URP
- Shader Material Inspector window reference for URP
- Blending Modes in URP
- Lit Shader Material Inspector window reference for URP
- Simple Lit Shader Material Inspector window reference for URP
- Complex Lit Shader Material Inspector window reference for URP
- Baked Lit Shader Material Inspector window reference for URP
- Unlit Shader Material Inspector window reference for URP
- Terrain Lit Shader Material Inspector window reference for URP
- Particles Lit Shader Material Inspector window reference for URP
- Particles Simple Lit Shader Material Inspector window reference for URP
- Particles Unlit Shader Material Inspector window reference for URP
- Canvas Shader Graph
- Shaders in the Built-In Render Pipeline
- Prebuilt shaders in the Built-In Render Pipeline
- Standard Shader in the Built-In Render Pipeline
- Introduction to the Standard Shader in the Built-In Render Pipeline
- Choose a metallic or specular shader in the Built-In Render Pipeline
- Configuring material properties in the Standard Shader in the Built-In Render Pipeline
- Make a material transparent
- Set the color of a material in the Standard Shader
- Configure reflections with the Standard Shader
- Configure edge reflections (Fresnel effect)
- Configure specular reflections in the Standard Shader
- Configure smoothness with the Standard Shader
- Set the Rendering Mode in the Standard Shader using a script
- Standard Shader realistic settings in the Built-In Render Pipeline reference
- Customize the Standard shader source code in the Built-In Render Pipeline
- Standard Shader Material Inspector window reference for the Built-In Render Pipeline
- Particle shaders in the Built-In Render Pipeline
- Autodesk Interactive shader in the Built-In Render Pipeline
- Standard Shader in the Built-In Render Pipeline
- Replace shaders at runtime in the Built-In Render Pipeline
- Writing custom shaders in the Built-In Render Pipeline
- Writing Surface Shaders
- Introduction to surface shaders in the Built-In Render Pipeline
- Surface Shader output structures in the Built-In Render Pipeline
- Surface Shaders and rendering paths in the Built-In Render Pipeline
- Create a surface shader in the Built-In Render Pipeline
- Set the lighting model in a Surface Shader in the Built-In Render Pipeline
- Optimize Surface Shaders
- Surface Shader examples in the Built-In Render Pipeline
- Normal mapping Surface Shader example in the Built-In Render Pipeline
- Reflection Surface Shader examples in the Built-In Render Pipeline
- Vertex modifier Surface Shader example in the Built-In Render Pipeline
- Custom data Surface Shader example in the Built-In Render Pipeline
- Final color modifier Surface Shader example in the Built-In Render Pipeline
- Decals Surface Shader example in the Built-In Render Pipeline
- Wrapped diffuse Surface Shader example in the Built-In Render Pipeline
- Toon shading Surface Shader example in the Built-In Render Pipeline
- Global illumination Surface Shader example in the Built-In Render Pipeline
- Tessellation Surface Shader examples in the Built-In Render Pipeline
- Surface Shader language reference for the Built-In Render Pipeline
- Shader methods in the Built-In Render Pipeline
- Get the current framebuffer with the GrabPass command
- HLSL shader examples in the Built-in Render Pipeline
- Single color shader example in the Built-In Render Pipeline
- Checkerboard pattern shader example in the Built-In Render Pipeline
- Simple unlit shader example in the Built-In Render Pipeline
- Mesh normals shader example in the Built-In Render Pipeline
- Reflections shader example in the Built-In Render Pipeline
- Normal map texturing shader example in the Built-In Render Pipeline
- Tri-planar texturing shader example in the Built-In Render Pipeline
- Simple diffuse lighting shader example in the Built-In Render Pipeline
- Ambient light shader example in the Built-In Render Pipeline
- Shadow casting shader example in the Built-In Render Pipeline
- Receiving shadows shader example in the Built-In Render Pipeline
- Fog shader example in the Built-In Render Pipeline
- Visualizing vertex data shader examples in the Built-In Render Pipeline
- Writing Surface Shaders
- Prebuilt shaders in the Built-In Render Pipeline
- Troubleshooting shaders
- Shader languages reference
- ShaderLab language reference
- Shader in ShaderLab reference
- SubShader in ShaderLab reference
- Pass in ShaderLab reference
- GPU render state commands in ShaderLab reference
- AlphaToMask command in ShaderLab reference
- Blend command in ShaderLab reference
- BlendOp command in ShaderLab reference
- ColorMask command in ShaderLab reference
- Conservative command in ShaderLab reference
- Cull command in ShaderLab reference
- Offset command in ShaderLab reference
- Stencil command in ShaderLab reference
- ZClip command in ShaderLab reference
- ZTest command in ShaderLab reference
- ZWrite command in ShaderLab reference
- PackageRequirements block in ShaderLab reference
- ShaderLab legacy functionality reference
- HLSL pragma directives reference
- HLSL pragma target command reference
- HLSL pragma require command reference
- Built-in shader variables reference
- ShaderLab language reference
- Materials
- Textures
- Visual effects
- Particle systems
- Choosing your particle system solution
- Create and view a Particle System
- Vary Particle System properties over time
- Configuring particles
- Access the Particle System from the Animation system
- Custom data streams in Particle Systems
- Particle System optimization
- Particle System component reference
- Particle System module component reference
- Activate and access Particle System modules
- Main module reference
- Emission module reference
- Shape module reference
- Velocity over Lifetime module reference
- Noise module reference
- Limit Velocity over Lifetime module reference
- Inherit Velocity module reference
- Lifetime by Emitter Speed module reference
- Force over Lifetime module reference
- Color over Lifetime module reference
- Color by Speed module reference
- Size over Lifetime module reference
- Size by Speed module reference
- Rotation over Lifetime module reference
- Rotation by Speed module reference
- External Forces module reference
- Collision module reference
- Triggers module reference
- Sub Emitters module reference
- Texture Sheet Animation module reference
- Lights module reference
- Trails module reference
- Custom Data module reference
- Renderer module reference
- Particle System Force Field component reference
- Decals and projectors
- Lens flares
- Light halos
- Lines and trails
- Visual Effect Graph
- Particle systems
- Rendering
- Render pipelines
- Introduction to render pipelines
- Scriptable Render Pipeline fundamentals
- Choosing a render pipeline
- Rendering paths in Unity
- Using the Universal Render Pipeline
- Introduction to the Universal Render Pipeline
- Requirements and compatibility for URP
- What's new in URP 17 (Unity 6)
- Get started with URP
- Universal Render Pipeline fundamentals
- Installing and upgrading URP
- Creating a URP project
- Upgrading from the Built-In Render Pipeline to URP
- Upgrade URP
- Upgrade to URP 17 (Unity 6)
- Upgrade to URP 16 (Unity 2023.2)
- Upgrade to URP 15 (Unity 2023.1)
- Upgrade to URP 14 (Unity 2022.2)
- Upgrade to URP 13 (Unity 2022.1)
- Upgrade to URP 12 (Unity 2021.2)
- Upgrade to version 11.0.x of the Universal Render Pipeline
- Upgrade to version 10.1.x of the Universal Render Pipeline
- Upgrade to version 10.0.x of the Universal Render Pipeline
- Upgrade to version 9.0.x of the Universal Render Pipeline
- Upgrade to version 8.2.x of the Universal Render Pipeline
- Upgrade to version 8.1.x of the Universal Render Pipeline
- Upgrade to version 8.0.0 of the Universal Render Pipeline
- Upgrade to version 7.4.0 of the Universal Render Pipeline
- Upgrade to version 7.3.0 of the Universal Render Pipeline
- Upgrade to version 7.2.0 of the Universal Render Pipeline
- Upgrade from the Lightweight Render Pipeline to the Universal Render Pipeline
- Known issues in URP
- Configure for better performance in URP
- Graphics quality settings in URP
- Add anti-aliasing in the Universal Render Pipeline
- Custom rendering and post-processing in URP
- Introduction to Scriptable Render Passes in URP
- Adding pre-built effects via Renderer Features in URP
- Custom render pass workflow in URP
- Blit in URP
- Render graph system in URP
- Introduction to the render graph system in URP
- Write a render pass using the render graph system in URP
- Textures in the Render Graph system in URP
- Frame data in the render graph system in URP
- Draw objects in the render graph system in URP
- Compute shaders in the render graph system in URP
- Analyze a render graph in URP
- Optimize a render graph
- Use Compatibility Mode APIs in render graph render passes
- Render Graph Viewer window reference for URP
- Adding a Scriptable Render Pass to the frame rendering loop in URP
- Modify URP source code
- Compatibility Mode in URP
- Universal Render Pipeline reference
- Using the High Definition Render Pipeline
- Using the Built-In Render Pipeline
- Post-processing and full-screen effects
- Introduction to post-processing
- Post-processing effect availability reference
- Post-processing and full-screen effects in URP
- Post-processing in URP
- Introduction to post-processing in URP
- Add post-processing in URP
- Volumes in URP
- Post-processing Volume Overrides reference for URP
- Bloom Volume Override reference for URP
- Channel Mixer Volume Override reference for URP
- Chromatic Aberration Volume Override reference for URP
- Color Adjustments Volume Override reference for URP
- Color Curves Volume Override reference for URP
- Depth of Field in URP
- Film Grain Volume Override reference for URP
- Lens Distortion Volume Override reference for URP
- Lift Gamma Gain Volume Override reference for URP
- Motion Blur Volume Override reference for URP
- Panini Projection Volume Override reference for URP
- Add screen space lens flares in URP
- Shadows Midtones Highlights Volume Override reference for URP
- Split Toning Volume Override reference for URP
- Tonemapping Volume Override reference for URP
- Vignette Volume Override reference for URP
- White Balance Volume Override reference for URP
- Custom post-processing in URP
- Post-processing in URP
- Color
- Graphics performance and profiling
- Reduce rendering work on the CPU or GPU
- Optimizing draw calls
- Profile rendering
- Graphics performance and profiling in URP
- Understand performance in URP
- Analyze your project in URP
- Reducing rendering work on the CPU or GPU in URP
- Optimizing draw calls in URP
- Scriptable Render Pipeline (SRP) Batcher in URP
- BatchRendererGroup API in URP
- Introduction to the BatchRendererGroup API in URP
- Set up your project for the BatchRendererGroup API in URP
- Creating a renderer with the BatchRendererGroup API in URP
- Writing custom shaders for the BatchRendererGroup API
- DOTS Instancing shaders in URP
- Support DOTS Instancing in a a custom shader in URP
- Declare DOTS Instancing properties in a custom shader in URP
- Access DOTS Instancing properties in a custom shader
- Best practice for DOTS Instancing shaders in URP
- DOTS Instancing shader examples in URP
- DOTS Instancing shader macros reference for URP
- DOTS Instancing shader functions reference for URP
- Rendering Debugger in URP
- Graphics performance and profiling in the Built-In Render Pipeline
- Creating custom shaders that support GPU instancing in the Built-In Render Pipeline
- GPU Instancing in the Built-In Render Pipeline
- Add per-instance properties to GPU instancing shaders in the Built-In Render Pipeline
- Examples of GPU instancing shaders in the Built-In Render Pipeline
- Prevent Unity stripping GPU instancing shaders in the Built-In Render Pipeline
- GPU instancing shader reference for the Built-In Render Pipeline
- Creating custom shaders that support GPU instancing in the Built-In Render Pipeline
- Graphics performance and profiling reference
- Render pipelines
- Audio
- Audio overview
- Audio files
- Tracker Modules
- Audio Mixer
- Native audio plug-in SDK
- Audio playlist randomization
- Audio Profiler module
- Ambisonic Audio
- Audio Reference
- Audio Clip
- Audio Listener
- Audio Source
- Audio Mixer
- Audio Filters
- Audio Effects
- Audio Low Pass Effect
- Audio High Pass Effect
- Audio Echo Effect
- Audio Flange Effect
- Audio Distortion Effect
- Audio Normalize Effect
- Audio Parametric Equalizer Effect
- Audio Pitch Shifter Effect
- Audio Chorus Effect
- Audio Compressor Effect
- Audio SFX Reverb Effect
- Audio Low Pass Simple Effect
- Audio High Pass Simple Effect
- Reverb Zones
- Microphone
- Audio Settings
- Video and cutscenes
- Scripting
- Get started with scripting
- Environment and tools
- Object-oriented development
- Managing time and frame rate
- Instantiating prefabs at runtime
- Handling events
- Splitting tasks across frames
- Interacting with web servers
- Adding functionality to objects at runtime
- Moving objects with vectors
- Rotation and oriention with quaternion
- Using common math functions
- Using randomness
- Gizmos and Handles
- Null references
- Unity attributes
- Compilation and code reload
- Script compilation
- Scripting backends
- Code and scene reload on entering Play mode
- Running project code on Editor launch
- Script serialization
- Integrating third-party code libraries (plug-ins)
- Code optimization
- Debugging and diagnostics
- Optimization
- Memory in Unity
- Unity Profiler
- Profiler introduction
- Collect performance data
- Navigating the Profiler window
- Adding profiling information to your code
- Running the Profiler in its own process
- Analyzing Profiler traces
- Profiler window reference
- Profiler Preferences reference
- Profiler command line arguments
- Profiler markers reference
- Profiler counters reference
- Profiling tools
- Platform development
- Cross-platform features and considerations
- Troubleshooting common cross-platform issues
- Using Unity as a Library in other applications
- Deep linking
- Xcode frame debugger Unity integration
- Build path requirements for target platforms
- Graphics API support
- Reducing the file size of your build
- Build Player Pipeline
- Accessibility for mobile applications
- Unity Remote
- Android
- Introducing Android
- Getting started with Android
- Developing for Android
- Android mobile scripting
- Input for Android devices
- Android application size restrictions
- Graphics for Android
- Testing and debugging
- Optimization for Android
- Create and use plug-ins in Android
- Integrating Unity into Android applications
- Android application entry points
- Deep linking on Android
- Device features and permissions
- Handle Android crashes
- Quit a Unity Android application
- Building and delivering for Android
- Dedicated Server
- Embedded systems
- iOS
- Introducing iOS
- Getting started with iOS
- Developing for iOS
- Building and delivering for iOS
- Linux
- macOS
- tvOS
- Universal Windows Platform
- Introduction to Universal Windows Platform
- Get started with Universal Windows Platform
- Develop for Universal Windows Platform
- Build and deliver for Universal Windows Platform
- visionOS
- Web
- Web introduction
- Web development
- Web Player settings
- Interaction with browser scripting
- Code examples: Call JavaScript and C/C++/C# functions in Unity
- Set up your JavaScript plug-in
- Call JavaScript functions from Unity C# scripts
- Call Unity C# script functions from JavaScript
- Call C/C++/C# functions from Unity C# scripts
- Compile a static library as a Unity plug-in
- Create callbacks between Unity C#, JavaScript, and C/C++/C# code
- JavaScript interface in Unity Web builds
- Replace deprecated browser interaction code
- Web native plug-ins for Emscripten
- Memory in Unity Web
- Cache behavior in Web
- Web graphics
- Audio in Web
- Video playback in Web
- Texture compression in Web
- Embedded resources in Web
- Input in Web
- Configure a Web Canvas size
- Web browser access to device features
- Web networking
- WebAssembly 2023
- Web performance considerations
- Debug and troubleshoot Web builds
- Build and distribute a Web application
- Windows
- XR
- Cross-platform features and considerations
- Unity Services
- Unity IAP
- Setting up Unity IAP
- Cross Platform Guide
- Codeless IAP
- Defining products
- Subscription Product support
- Initialization
- Browsing Product Metadata
- Initiating Purchases
- Processing Purchases
- Handling purchase failures
- Restoring Transactions
- Purchase Receipts
- Receipt validation
- Store Extensions
- Cross-store installation issues with Android in-app purchase stores
- Store Guides
- Implementing a Store
- Unity Distribution Portal
- Unity IAP
- Glossary
- Optimization
- Unity Profiler
- Collect performance data
- Memory performance data
- Memory Profiler module introduction
Memory Profiler module introduction
The Memory ProfilerA window that helps you to optimize your game. It shows how much time is spent in the various areas of your game. For example, it can report the percentage of time spent rendering, animating, or in your game logic. More info
See in Glossary module visualizes counters that represent the total allocated memory in your application. You can use the memory module to visualize where Unity allocated memory, and in what categories it spent memory.
The built-in Memory Profiler module displays a basic overview of memory allocations in your application.
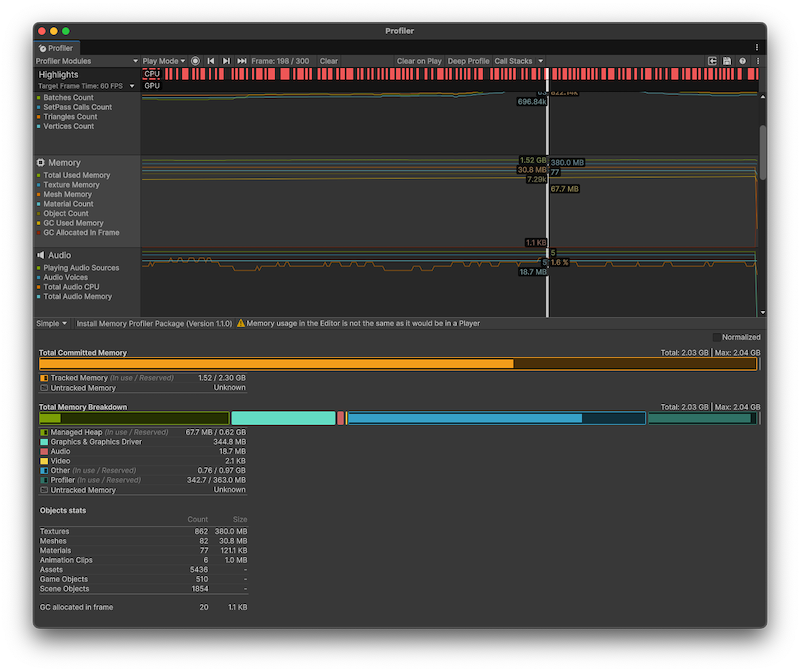
To view a detailed breakdown of memory usage in your application, use the Memory Profiler package. The package adds an additional Memory Profiler window to the Unity Editor, which you can then use to analyze memory usage in your application in more detail than the Memory Profiler module. You can store and compare snapshots to find memory leaks, or view the memory layout to find memory fragmentation issues. For more information about the Memory Profiler package, refer to the Memory Profiler package documentation.
Memory profiling in the Unity Editor
When you profile your application in Play mode, the Memory Profiler module reports higher data use than a similar profile of the application built on a target device. This is because the Unity Editor uses specific objects that take up memory, and the Editor window itself uses extra memory.
Part of the extra memory use is because Unity treats objects like textures as read/write enabled in the Editor and keeps an extra copy of each texture on the CPU. This effectively doubles the reported memory use of textures in the Editor. For a more accurate idea of memory use by textures, profile a built version of your application running on the target platform.
Unity can’t cleanly separate the memory that the Profiler itself takes up from the Play mode’s memory, so memory that the Profiler process uses is also displayed in the Profiler window.
To remind you of this, a warning displays at the top of the Memory Profiler module details pane whenever you have the Profiler target set to Play mode or Editor. For more precise numbers and memory usage for your application, profile your application on the target device and operating system you intend it to run on. For more information, refer to Profiling your application.
Additional resources
Did you find this page useful? Please give it a rating:
Thanks for rating this page!
What kind of problem would you like to report?
Thanks for letting us know! This page has been marked for review based on your feedback.
If you have time, you can provide more information to help us fix the problem faster.
Provide more information
You've told us this page needs code samples. If you'd like to help us further, you could provide a code sample, or tell us about what kind of code sample you'd like to see:
You've told us there are code samples on this page which don't work. If you know how to fix it, or have something better we could use instead, please let us know:
You've told us there is information missing from this page. Please tell us more about what's missing:
You've told us there is incorrect information on this page. If you know what we should change to make it correct, please tell us:
You've told us this page has unclear or confusing information. Please tell us more about what you found unclear or confusing, or let us know how we could make it clearer:
You've told us there is a spelling or grammar error on this page. Please tell us what's wrong:
You've told us this page has a problem. Please tell us more about what's wrong:
Thank you for helping to make the Unity documentation better!
Your feedback has been submitted as a ticket for our documentation team to review.
We are not able to reply to every ticket submitted.
Copyright ©2005-2025 Unity Technologies. All rights reserved. Built from 6000.0.45f1 (ba441301563b). Built on: 2025-03-21.