Manual
- Unity User Manual (2018.3)
- Working in Unity
- Getting Started
- Unity Hub
- Installing Unity using the Hub
- Adding components to the Unity Editor
- Installing Unity without the hub
- Installing Unity offline without the Hub
- Unity Hub advanced deployment considerations
- Proyectos 2D o 3D
- Project Templates
- Starting Unity for the first time
- Opening existing Projects
- Learning the interface
- Asset Workflow
- The Main Windows
- Creating Gameplay
- Editor Features
- Desarrollo Avanzado
- Temas Avanzados del Editor
- Licenses and Activation
- Upgrade Guides
- Using the Automatic API Updater
- Upgrading to Unity 2018.3
- Upgrading to Unity 2018.2
- Upgrading to Unity 2018.1
- Upgrading to Unity 2017.3
- Upgrading to Unity 2017.2
- Upgrading to Unity 2017.1
- Upgrading to Unity 5.6
- Upgrading to Unity 5.5
- Upgrading to Unity 5.4
- Upgrading to Unity 5.3
- Upgrading to Unity 5.2
- Upgrading to Unity 5.0
- Upgrading to Unity 4.0
- Upgrading to Unity 3.5
- Getting Started
- Importing
- 2D
- Gameplay in 2D
- 2D Sorting
- Sprites
- Tilemap
- Physics Reference 2D
- Graphics
- Graphics Overview
- Lighting
- Lighting overview
- Lighting Window
- Light Explorer
- Light sources
- Shadows
- Global Illumination
- Lightmapping
- Lightmap Parameters
- Baked ambient occlusion
- LOD for baked lightmaps
- Light Probes
- Reflection probes
- Lighting Modes
- GI visualizations in the Scene view
- Lighting Data Asset
- Lightmap Directional Modes
- Lightmaps: Technical information
- Material properties and the GI system
- Global Illumination UVs
- GI cache
- Light troubleshooting and performance
- Related topics
- Cameras
- Materials, Shaders & Textures
- Textures
- Creating and Using Materials
- Standard Shader
- Standard Particle Shaders
- Physically Based Rendering Material Validator
- Accessing and Modifying Material parameters via script
- Writing Shaders
- Legacy Shaders
- Video overview
- Terrain Engine
- Tree Editor
- Particle Systems
- Post-processing overview
- Advanced Rendering Features
- Procedural Mesh Geometry
- Optimizing graphics performance
- Layers
- Lighting
- Graphics Reference
- Cameras Reference
- Shader Reference
- Writing Surface Shaders
- Writing vertex and fragment shaders
- Vertex and fragment shader examples
- Shader semantics
- Accessing shader properties in Cg/HLSL
- Providing vertex data to vertex programs
- Built-in shader include files
- Predefined Shader preprocessor macros
- Built-in shader helper functions
- Built-in shader variables
- Making multiple shader program variants
- GLSL Shader programs
- Shading Language used in Unity
- Shader Compilation Target Levels
- Shader data types and precision
- Using sampler states
- ShaderLab Syntax
- Shader assets
- Advanced ShaderLab topics
- Unity's Rendering Pipeline
- Performance tips when writing shaders
- Rendering with Replaced Shaders
- Custom Shader GUI
- Using Depth Textures
- Camera's Depth Texture
- Platform-specific rendering differences
- Shader Level of Detail
- Texture arrays
- Debugging DirectX 11/12 shaders with Visual Studio
- Debugging DirectX 12 shaders with PIX
- Implementing Fixed Function TexGen in Shaders
- Particle Systems reference
- Particle System
- Particle System modules
- Particle System Main module
- Emission module
- Shape Module
- Velocity over Lifetime module
- Noise module
- Limit Velocity Over Lifetime module
- Inherit Velocity module
- Force Over Lifetime module
- Color Over Lifetime module
- Color By Speed module
- Size over Lifetime module
- Size by Speed module
- Rotation Over Lifetime module
- Rotation By Speed module
- External Forces module
- Collision module
- Triggers module
- Sub Emitters module
- Texture Sheet Animation module
- Lights module
- Trails module
- Custom Data module
- Renderer module
- Particle System Force Field
- Particle Systems (Legacy, prior to release 3.5)
- Visual Effects Reference
- Mesh Components
- Texture Components
- Rendering Components
- Rendering Pipeline Details
- Graphics HOWTOs
- How do I Import Alpha Textures?
- How do I Make a Skybox?
- How do I make a Mesh Particle Emitter? (Legacy Particle System)
- How do I make a Spot Light Cookie?
- How do I fix the rotation of an imported model?
- Water in Unity
- Art Asset best practice guide
- Importing models from 3D modeling software
- How to do Stereoscopic Rendering
- Graphics Tutorials
- Scriptable Render Pipeline
- Graphics Overview
- Physics
- Scripting
- Scripting Overview
- Creating and Using Scripts
- Variables and the Inspector
- Controlling GameObjects using components
- Event Functions
- Time and Framerate Management
- Creating and Destroying GameObjects
- Coroutines
- Namespaces
- Attributes
- Order of Execution for Event Functions
- Understanding Automatic Memory Management
- Platform dependent compilation
- Special folders and script compilation order
- Script compilation and assembly definition files
- Managed code stripping
- .NET profile support
- Referencing additional class library assemblies
- Stable scripting runtime: known limitations
- Generic Functions
- Scripting restrictions
- Script Serialization
- UnityEvents
- What is a Null Reference Exception?
- Important Classes
- Vector Cookbook
- Scripting Tools
- Event System
- C# Job System
- Scripting Overview
- Multiplayer and Networking
- Multiplayer Overview
- Setting up a multiplayer project
- Using the Network Manager
- Using the Network Manager HUD
- The Network Manager HUD in LAN mode
- The Network Manager HUD in Matchmaker mode
- Converting a single-player game to Unity Multiplayer
- Debugging Information
- The Multiplayer High Level API
- Multiplayer Component Reference
- Multiplayer Classes Reference
- UnityWebRequest
- Audio
- Audio Overview
- Audio files
- Tracker Modules
- Audio Mixer
- Native Audio Plugin SDK
- Audio Profiler
- Ambisonic Audio
- Audio Reference
- Audio Clip
- Audio Listener
- Audio Source
- Audio Mixer
- Audio Filters
- Audio Effects
- Audio Low Pass Effect
- Audio High Pass Effect
- Audio Echo Effect
- Audio Flange Effect
- Audio Distortion Effect
- Audio Normalize Effect
- Audio Parametric Equalizer Effect
- Audio Pitch Shifter Effect
- Audio Chorus Effect
- Audio Compressor Effect
- Audio SFX Reverb Effect
- Audio Low Pass Simple Effect
- Audio High Pass Simple Effect
- Reverb Zones
- Microphone
- Audio Settings
- Animation
- Animation System Overview
- Animation Clips
- Animator Controllers
- Retargeting of Humanoid animations
- Performance and optimization
- Animation Reference
- Animation FAQ
- Playables API
- A Glossary of animation terms
- Timeline
- UI
- Navigation and Pathfinding
- Navigation Overview
- Navigation System in Unity
- Inner Workings of the Navigation System
- Building a NavMesh
- NavMesh building components
- Advanced NavMesh Bake Settings
- Creating a NavMesh Agent
- Creating a NavMesh Obstacle
- Creating an Off-mesh Link
- Building Off-Mesh Links Automatically
- Building Height Mesh for Accurate Character Placement
- Navigation Areas and Costs
- Loading Multiple NavMeshes using Additive Loading
- Using NavMesh Agent with Other Components
- Navigation Reference
- Navigation How-Tos
- Navigation Overview
- Unity Services
- Setting up your project for Unity Services
- Unity Organizations
- Unity Ads
- Unity Analytics
- Unity Analytics Overview
- Setting Up Analytics
- Analytics Dashboard
- Analytics events
- Funnels
- Remote Settings
- Unity Analytics A/B Testing
- Monetization
- User Attributes
- Unity Analytics Raw Data Export
- Data reset
- Upgrading Unity Analytics
- COPPA Compliance
- Unity Analytics and the EU General Data Protection Regulation (GDPR)
- Analytics Metrics, Segments, and Terminology
- Unity Cloud Build
- Automated Build Generation
- Supported platforms
- Supported versions of Unity
- Version control systems
- Using the Unity Developer Dashboard to configure Unity Cloud Build for Git
- Using the Unity Editor to configure Unity Cloud Build for Git
- Using the Unity Developer Dashboard to configure Unity Cloud Build for Mercurial
- Using the Unity Editor to configure Unity Cloud Build for Mercurial
- Using Apache Subversion (SVN) with Unity Cloud Build
- Using the Unity Developer Dashboard to configure Unity Cloud Build for Perforce
- Using the Unity Editor to configure Unity Cloud Build for Perforce
- Building for iOS
- Advanced options
- Build manifest
- Cloud Build REST API
- Unity IAP
- Setting up Unity IAP
- Cross Platform Guide
- Codeless IAP
- Defining products
- Subscription Product support
- Initialization
- Browsing Product Metadata
- Initiating Purchases
- Processing Purchases
- Handling purchase failures
- Restoring Transactions
- Purchase Receipts
- Receipt validation
- Store Extensions
- Cross-store installation issues with Android in-app purchase stores
- Store Guides
- Implementing a Store
- IAP Promo
- Unity Collaborate
- Setting up Unity Collaborate
- Adding team members to your Unity Project
- Viewing history
- Enabling Cloud Build with Collaborate
- Managing Unity Editor versions
- Reverting files
- Resolving file conflicts
- Excluding Assets from publishing to Collaborate
- Publishing individual files to Collaborate
- Restoring previous versions of a project
- In-Progress edit notifications
- Managing cloud storage
- Moving your Project to another version control system
- Collaborate troubleshooting tips
- Unity Cloud Diagnostics
- Unity Integrations
- Multiplayer Services
- XR
- XR SDKs
- Google VR
- Vuforia
- Windows Mixed Reality
- Unity XR input
- XR API reference
- Mixed Reality Devices
- VR overview
- VR devices
- Single Pass Stereo rendering (Double-Wide rendering)
- VR Audio Spatializers
- VR frame timing
- XR SDKs
- Open-source repositories
- Asset Store Publishing
- Platform-specific
- Standalone
- macOS
- Apple TV
- WebGL
- Player settings for the WebGL platform
- Getting started with WebGL development
- WebGL Browser Compatibility
- Building and running a WebGL project
- WebGL: Deploying compressed builds
- Debugging and troubleshooting WebGL builds
- WebGL Graphics
- WebGL Networking
- Using Audio In WebGL
- WebGL performance considerations
- Memory in WebGL
- WebGL: Interacting with browser scripting
- Using WebGL Templates
- Cursor locking and full-screen mode in WebGL
- Input in WebGL
- iOS
- Getting started with iOS development
- Player settings for the iOS platform
- iOS 2D Texture Overrides
- Upgrading to 64-bit iOS
- iOS Advanced Topics
- Features currently not supported by Unity iOS
- Troubleshooting on iOS devices
- Reporting crash bugs on iOS
- Android
- Empezar con el desarrollo de Android
- Android environment setup
- Unity Remote
- Android Remote (OBSOLETO)
- Troubleshooting Android development
- Building apps for Android
- Reporting crash bugs under Android
- Support for APK expansion files (OBB)
- Scripting para Android
- Building and using plug-ins for Android
- Customizing an Android Splash Screen
- Un Solo Pase de Stereo Rendering para Android
- Player settings for the Android platform
- Android 2D Textures Overrides
- Gradle for Android
- Android Manifest
- Empezar con el desarrollo de Android
- Windows
- Windows General
- Universal Windows Platform
- Getting Started
- Universal Windows Platform: Deployment
- Universal Windows Platform: Profiler
- Universal Windows Platform: Command line arguments
- Universal Windows Platform: Association launching
- AppCallbacks class
- Universal Windows Platform: WinRT API in C# scripts
- Player settings for the Universal Windows platform
- Scripting Backends
- FAQ
- Universal Windows Platform: Examples
- Universal Windows Platform: Code snippets
- Known issues
- Web Player
- Mobile Developer Checklist
- Experimental
- Legacy Topics
- Best practice guides
- Expert guides
- New in Unity 2018.3
- Packages Documentation
- Glossary
Data Explorer
Build reports for your Unity Analytics metrics and events using the Data Explorer. The Data Explorer reports show how selected metrics and custom events change over time.
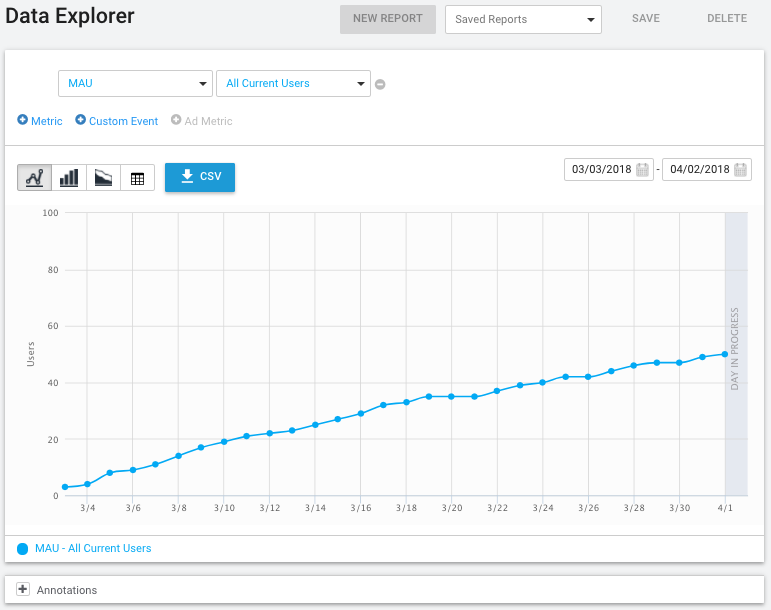
Create a new report
To create a Data Explorer report:
- Navigate to the Analytics dashboard for your project.
- Click Data Explorer.
- Add Metrics, Custom Events, and Ad Metrics to the report by clicking the + buttons next to the desired type of data. (The Ad Metrics option is disabled for projects not using Unity Ads.)

- Set the date range and chart type as desired. See Report Options for more information.
Note: The default report includes a single metric. You can change the metric type and segment for this item. (To delete this item, you must first add a second item – you cannot delete the last data item on a report.)
To save a report for future viewing:
Click the New Report button.
On the dialog that opens, enter a name for the report and click OK.
To view a saved report in the future, click the Saved Reports dropdown and select the report name in the list. You can adjust the date range to view the same report with your latest data.
Copy a report
To copy an existing Data Explorer report:
Navigate to your Analytics dashboard for your project.
Click Data Explorer.
Click the Saved Reports dropdown and select the report name in the list.

Adjust the date range, chart type or other options as desired. See Report Options for more information.
Click the New Report button.
On the dialog that opens, enter a name for the report copy and click Ok.
Download report data
To download a comma-separated value file (CSV) containing the data in a report:
- Navigate to your Analytics dashboard for your project.
- Click Data Explorer.
- Load a saved report or create a new one.
- Adjust the date range or other options as desired. See Report Options for more information. Click the CSV button to download the data for the currently displayed report.
Note: CSV download exports precisely what you see in the chart/table. If you have a Unity Pro subscription, you can also download all of your Analytics data in raw form from the Raw Data Export page or through the Raw Data Export REST API.
Report options
You can add the following types of data to a report:
- Metric – Analytics metrics are computed from the Core Analytics events sent automatically whenever someone plays your game. These metrics include such things as how many people played your game, how long they played, and how much money they spent on in-app purchases.
- Custom Event – Custom events are the events that you dispatch from your game to measure behavior or other factors unique to your game. See Custom events for more information about defining and using custom events.
- Ad Metric – Ad metrics report data from the Unity Ads Service (only available if you are using Unity Ads.)

You can add up to twenty data items to a single report. The charts will display the appropriate units for the vertical scale as long as there are no more than two data items that use different units of measure.
You can set the date range for a report and select different chart types.
Metric and Ad Metric options
When you add a Metric or Ad Metric to the chart, you must set the name and can choose a data Segment:

- A – The metric name
- B – The segment of the data to show
- C – Delete the metric from the report
For each data item, you can specify a Segment of the data to display. A Segment is a subset of the data for that item, selected according to a set of rules. For example, the Android Users segment includes data only for players on the Android platform, while the iOS Users segment includes data only for players on the iOS platform.
The Analytics Service includes a set of standard segments. You can also create your own custom Segments. Use the Segment Builder to view the definitions of the standard segments and to build your own custom Segments. Note that when you create a custom Segment, it only applies to newly collected metrics and events. Older data is not reprocessed for inclusion in a new Segment.
Custom event options
When you add a Custom Event to a report, you can set additional options based on the event parameters.

- A – Show a pie chart (only for categorizable data items)
- B – The name of the Custom Event
- C – The Segment of the data to show
- D – The custom event Parameter name and display options
- E – How to aggregate parameter values
- F – Delete the custom event from the report
When a Custom Event has parameters, you can choose how the data for that event is displayed on the chart. You can show the count of each distinct value received or, for numeric properties, the sum or average of the values of all the events received:
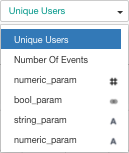
The symbols displayed after the Parameter name indicate how the Parameter is displayed. The string (A) and boolean (Venn diagram) symbols indicate that the Parameter values are categorizable into distinct groups. The numeric symbol (#) indicates that the Parameter value is a number that can be averaged or summed in addition to being counted. Note that numeric Parameters appear in the list twice, once with a string symbol and once with a numeric symbol, giving you the option of treating a numeric Parameter as either a categorizable or a aggregatable value.
When showing categorizable Parameter values, only the ten most common values are broken out into individual groups. The rest of the values are lumped together in an Other group. Thus, treating numeric Parameters as categorizable strings is generally only useful for Parameters with a limited set of distinct values.
You can view the set of distinct values at the bottom of the chart. You can also view a pie-chart of the values by clicking the pie-chart button in front of the data item. Only a single pie chart can be displayed at a time.
Note: To download the data in a categorizable-data pie chart, click the pie-chart button next to the Custom Event before clicking the CSV button.
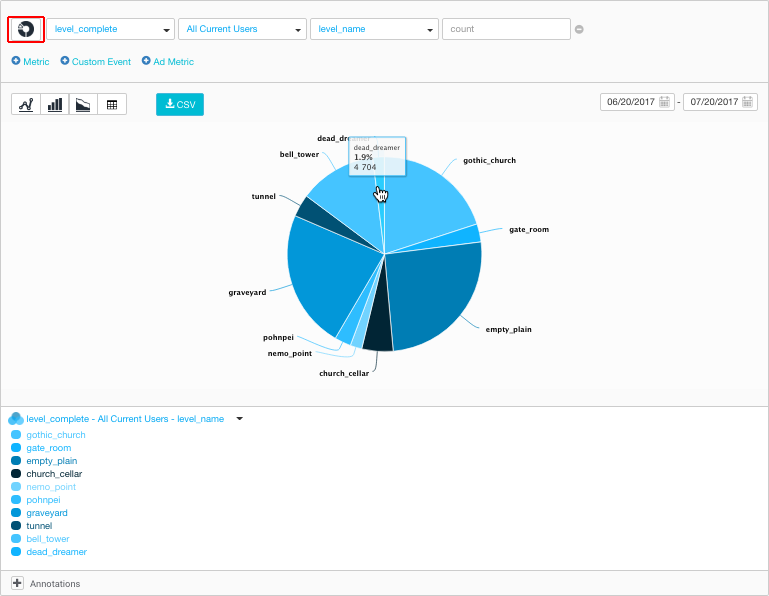
Chart types
You can choose the following chart types for a report:

- Spline – A smoothed line chart
- Column – A bar chart
- Stacked – A stacked area chart
- Table – A table of values
- Pie – A pie chart (only available for individual, categorizable Custom Event parameters)
Chart Zoom
You can zoom in on the Spline, Column and Stacked charts by clicking on the chart and dragging across the section you want to view in more detail.
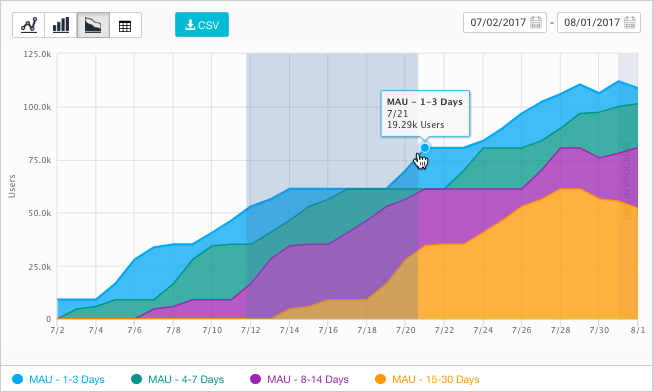
When you are zoomed in, the chart displays a Reset Zoom button, which restores the chart to display the entire date range.
Annotations
You can use annotations to mark the dates of important external factors that might affect your game’s analytics data, such as game updates, marketing campaigns, and promotions. Add date-based annotations to the Data Explorer reports using the Annotations section below the report chart.
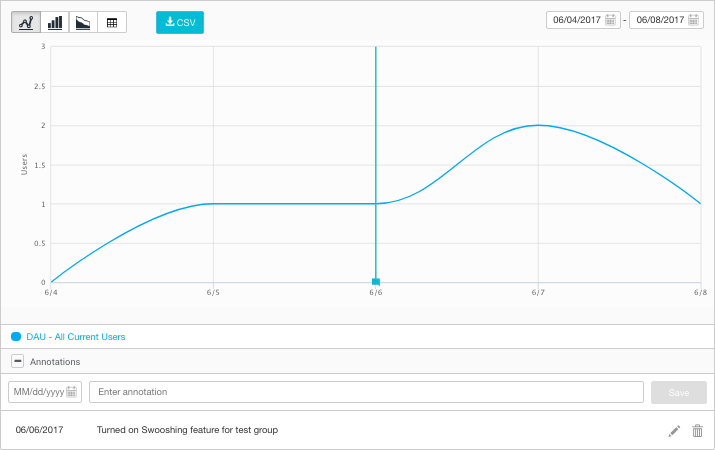
Annotations are project-wide, not specific to an individual report. Annotations display on all report charts whenever the Annotations section is open.
To add an annotation:
- On any Data Explorer report, click the + Annotations button to open the Annotations section (if not already open).
- Click in the date box and set the date for the annotation. You can only add one annotation record for a given day.
- Enter a name or descriptive text for the annotation.
- Click Save.
- 2017–08–29 Page published with editorial review
- New feature in Unity 2017.1