Manual
- Unity User Manual (2019.4 LTS)
- Packages
- Verified packages
- 2D Animation
- 2D Common
- 2D Path
- 2D Pixel Perfect
- 2D PSD Importer
- 2D SpriteShape
- Adaptive Performance
- Adaptive Performance Samsung Android
- Addressables
- Advertisement
- Alembic
- Analytics Library
- Android Logcat
- AR Foundation
- AR Subsystems
- ARCore XR Plugin
- ARKit Face Tracking
- ARKit XR Plugin
- Asset Bundle Browser
- Barracuda
- Burst
- Core RP Library
- Custom NUnit
- Editor Coroutines
- Google Resonance Audio
- Google VR Android
- Google VR iOS
- High Definition RP
- High Definition RP Config
- In App Purchasing
- Input System
- Lightweight RP
- Magic Leap XR Plugin
- Mathematics
- Mobile Notifications
- Multiplayer HLAPI
- Oculus Android
- Oculus Desktop
- Oculus XR Plugin
- OpenVR Desktop
- Polybrush
- Post Processing
- ProBuilder
- Profile Analyzer
- Quick Search
- Remote Config
- Scriptable Build Pipeline
- Searcher
- Settings Manager
- Shader Graph
- Subsystem Registration
- Test Framework
- TextMesh Pro
- Timeline
- Unity Collaborate
- Universal RP
- Visual Effect Graph
- Vuforia Engine AR
- Windows Mixed Reality
- Windows XR Plugin
- XR Interaction Subsystems
- XR Legacy Input Helpers
- XR Plugin Management
- Preview packages
- 2D Entities
- 2D IK
- AI Planner
- Animation Rigging
- Asset Graph
- Build Report Inspector
- Cinemachine
- Code Coverage
- Collections
- Device Simulator
- DOTS Editor
- Entities
- FBX Exporter
- Film and TV Toolbox
- Game Foundation
- Havok Physics for Unity
- Hybrid Renderer
- Immediate Window
- Jobs
- Kinematica
- Profiler de Memoria
- MeshSync
- ML Agents
- MockHMD XR Plugin
- Package Development
- Package Validation Suite
- Performance testing API
- Platforms
- Platforms Android
- Platforms Linux
- Platforms macOS
- Platforms Web
- Platforms Windows
- PlayableGraph Visualizer
- ProGrids
- Project Tiny Full
- Streaming Image Sequence
- Terrain Tools
- UI Builder
- Unity AOV Recorder
- Unity Distribution Portal
- Unity NetCode
- Unity Physics
- Unity Recorder
- Unity Reflect
- Unity Render Streaming
- Unity Simulation Client
- Unity Simulation Core
- Unity Transport
- Unity User Reporting
- USD
- Vector Graphics
- WebGL Publisher
- WebRTC
- Xiaomi SDK
- XR Interaction Toolkit
- Built-in packages
- 2D Sprite
- 2D Tilemap Editor
- AI
- Android JNI
- Animation
- Asset Bundle
- Audio
- Cloth
- Director
- Image Conversion
- IMGUI
- JSONSerialize
- Particle System
- Physics
- Physics 2D
- Screen Capture
- Subsystems
- Terrain
- Terrain Physics
- Tilemap
- UI
- UIElements
- Umbra
- Unity Analytics
- Unity UI
- Unity Web Request
- Unity Web Request Asset Bundle
- Unity Web Request Audio
- Unity Web Request Texture
- Unity Web Request WWW
- Vehicles
- Video
- VR
- Wind
- XR
- Packages by keywords
- Unity's Package Manager
- Creating custom packages
- Verified packages
- New in Unity 2019
- Working in Unity
- Installing Unity
- Unity's interface
- Asset workflow
- Creación del Gameplay
- Características del Editor
- 2D and 3D mode settings
- Preferences
- Presets
- Shortcuts Manager
- Build Settings
- Project Settings
- Integración Visual Studio C#
- Integración con RenderDoc
- Xcode Frame Debugger integration
- Analiticas del Editor
- Buscar Actualizaciones
- IME en Unity
- Nombres de carpetas de especiales
- Reusing Assets between Projects
- Control de Versiones
- Multi-Scene editing
- Command line arguments
- Support for custom Menu Item and Editor features
- Archivos de escena basados en texto
- Extendiendo el Editor
- Configurable Enter Play Mode
- Solución de Problemas del Editor
- Analysis
- Profiler overview
- Getting started with the Profiler window
- Profiling your application
- Audio Profiler module
- CPU Usage Profiler module
- Global Illumination Profiler module
- GPU Usage Profiler module
- Memory Profiler module
- Physics Profiler module
- 2D Physics Profiler module
- Área de Renderización(Rendering Area)
- UI and UI Details Profiler
- Video Profiler module
- Profiler overview
- Guías de Actualización
- Using the API Updater
- Upgrading to Unity 2019 LTS
- Upgrading to Unity 2018 LTS
- Upgrading to Unity 2017.3
- Upgrading to Unity 2017.2
- Upgrading to Unity 2017.1
- Upgrading to Unity 5.6
- Upgrading to Unity 5.5
- Actualizando a Unity 5.4
- Actualizarse a Unity 5.3
- Actualizándose a Unity 5.2
- Actualizando a Unity 5.0
- Guía de Actualización de Unity 3.5 a 4.0
- Actualizando a Unity 3.5
- Importing
- Input
- 2D
- Experiencia de Juego en 2D
- asdf
- Sprites
- Tilemap
- Physics Reference 2D
- Gráficos
- Render pipelines
- Built-in Render Pipeline
- Universal Render Pipeline
- High Definition Render Pipeline
- Scriptable Render Pipeline
- Scriptable Render Pipeline introduction
- Creating a custom Scriptable Render Pipeline
- Creating a Render Pipeline Asset and Render Pipeline Instance
- Setting the active Render Pipeline Asset
- Scheduling and executing rendering commands in the Scriptable Render Pipeline
- Scriptable Render Pipeline (SRP) Batcher
- Cámaras
- Post-processing
- Lighting
- Introduction to lighting
- Light sources
- Shadows
- The Lighting window
- The Light Explorer window
- Lightmapping
- The Progressive Lightmapper
- Lightmapping using Enlighten (deprecated)
- Lightmapping: Getting started
- Lightmap Parameters Asset
- Directional Mode
- Lightmaps and LOD
- Ambient occlusion
- Lightmaps: Technical information
- Lightmapping and the Shader Meta Pass
- Lightmap UVs
- UV overlap
- Lightmap seam stitching
- Custom fall-off
- Realtime Global Illumination using Enlighten (deprecated)
- Light Probes
- Reflection Probes
- Precomputed lighting data
- Scene View Draw Modes for lighting
- Meshes, Materials, Shaders and Textures
- Componentes Mesh
- Creando y utilizando Materiales
- Texturas 2D
- Sombreadores(Shaders) con Funciones Fijas
- Standard Shader
- Standard Particle Shaders
- Legacy Shaders (Shaders de Legado)
- Referencia del Shader
- Writing Surface Shaders
- Writing vertex and fragment shaders
- Ejemplos del Vertex y Fragment Shader
- Semánticas de Shader
- Accediendo propiedades shader en Cg/HLSL
- Proporcionar datos del vértice a programas vertex
- El Sombreador integrado incluye archivos
- Macros del preprocesador Shader predefinidas
- Funciones Shader integradas de ayuda
- Variables shader integradas
- Shader variants and keywords
- GLSL Shader programs
- Shading language used in Unity
- Niveles Objetivo de Compilación Shader
- Tipos de dato Shader y precisión
- Using sampler states
- Sintaxis ShaderLab
- Assets Shader
- Temas Avanzados de ShaderLab
- Optimizing shader variants
- Asynchronous Shader compilation
- Consejos de rendimiento al escribir shaders
- Rendering con Shaders Remplazados
- Custom Shader GUI (GUI Shader Personalizado)
- Utilizando Depth Textures (Texturas de profundidad)
- La Depth Texture (Textura de Profundidad) de la cámara
- Diferencias especificas de rendering por plataforma
- ShaderLab: SubShader LOD value
- Using texture arrays in shaders
- Debugging DirectX 11/12 shaders with Visual Studio
- Debugging DirectX 12 shaders with PIX
- Implementando la Función Fija TexGen en Shaders
- Tutorial: ShaderLab and fixed function shaders
- Tutorial: vertex and fragment programs
- Particle systems
- Choosing your particle system solution
- Built-in Particle System
- Using the Built-in Particle System
- Particle System vertex streams and Standard Shader support
- Particle System GPU Instancing
- Particle System C# Job System integration
- Components and Modules
- Particle System
- Módulos del Sistema de Partículas
- Particle System Main module
- Emission module
- Módulo Shape (forma)
- Velocity over Lifetime module
- Noise module
- Limit Velocity Over Lifetime module
- Inherit Velocity module
- Force Over Lifetime module
- Color Over Lifetime module
- Color By Speed module
- Módulo Size Over Lifetime
- Módulo Size By Speed
- Rotation Over Lifetime module
- Rotation By Speed module
- External Forces module
- Collision module
- Módulo Triggers
- Sub Emitters module
- Texture Sheet Animation module
- Lights module
- Trails module
- Módulo de datos personalizados
- Renderer module
- Particle System Force Field
- Built-in Particle System examples
- Visual Effect Graph
- Creating environments
- Sky
- Visual Effects Components
- Advanced rendering features
- Optimizando el Rendimiento Gráfico
- Color space
- Graphics tutorials
- Render pipelines
- Física
- Scripting
- Visión General de Scripting
- Creando y usando scripts
- Variables and the Inspector
- Controlar GameObjects utilizando componentes
- Event Functions (Funciones de Evento)
- Administrador del Tiempo y Framerate
- Creando y destruyendo GameObjects.
- Coroutines (corrutinas)
- Namespaces
- Attributes
- Order of Execution for Event Functions
- Understanding Automatic Memory Management
- Compilación dependiente de la plataforma
- Carpetas especiales y orden de compilación script
- Assembly Definitions
- Managed code stripping
- .NET profile support
- Referencing additional class library assemblies
- Stable scripting runtime: known limitations
- Generic Functions
- Scripting restrictions
- Script Serialization
- UnityEvents (Eventos de Unity)
- Qué es una Null Reference Exception? (Excepción con Referencia Null)
- Importando Clases
- "Recetas" para usar Vectores
- JSON Serialization
- ScriptableObject
- Corriendo Código Script del Editor en la Ejecución
- Herramientas de Scripting
- C# Job System
- Plug-ins
- Visión General de Scripting
- Multijugador y Networking (redes)
- Multiplayer Overview
- Configurando un proyecto multijugador
- Using the Network Manager
- Using the Network Manager HUD
- The Network Manager HUD in LAN mode
- The Network Manager HUD in Matchmaker mode
- Converting a single-player game to Unity Multiplayer
- Debugging Information
- La API de Alto Nivel Multijugador
- Multiplayer Component Reference
- Clases Multijugador de referencia
- Multiplayer Encryption Plug-ins
- UnityWebRequest
- Audio
- Vista General del Audio
- Archivos de Audio
- Tracker Modules
- Audio Mixer (Mezclador de Audio)
- Plugin SDK del Audio Nativo de Unity
- Audio Profiler (Perfilador de Audio)
- Ambisonic Audio
- Referencias de Audio
- Audio Clip
- Audio Listener
- Audio Source (Fuente de Audio)
- Audio Mixer (Mezclador de Audio)
- Audio Filters (Filtros de Audio)
- Audio Effects (Efectos de audio)
- Audio Low Pass Effect
- Audio High Pass Effect
- Audio Echo Effect
- Audio Flange Effect
- Audio Distortion Effect
- Audio Normalize Effect
- Audio Parametric Equalizer Effect
- Audio Pitch Shifter Effect
- Audio Chorus Effect
- Audio Compressor Effect
- Audio SFX Reverb Effect
- Audio Low Pass Simple Effect
- Audio High Pass Simple Effect
- Reverb Zones (Zonas de reverberación)
- Micrófono
- Configuraciones de Audio
- Descripción general de video
- Animación
- Visión general del Sistema de Animación
- Clips de Animación (Animation Clips)
- Animator Controllers
- El Asset del Animator Controller
- La Ventana Animator
- Animation State Machines (Máquinas de Estado de Animación)
- Lo básico de los Estados de Maquina
- Parámetros de animación
- Transiciones de State Machine (Estados de Maquina)
- State Machine Behaviours (Comportamientos de Maquinas de Estado)
- Sub-State Machines (Sub-Estados de Maquina)
- Capas de Animación
- Funcionalidad "Solo" y "Mute"
- Target Matching (Haciendo que coincida con un objetivo)
- Inverse Kinematics (Cinemática Inversa)
- Root Motion - Cómo funciona
- Blend Trees (Árboles de Mezcla)
- Working with blend shapes
- Animator Override Controllers
- Retargeting de Animaciones Humanoides
- Performance and optimization
- Animation Reference
- Preguntas más frecuentes de Animación
- Playables API
- Un Glosario de términos de Animación
- User interfaces (UI)
- UIElements Developer Guide
- Unity UI
- Canvas
- Diseño Básico
- Componentes Visuales
- Componentes de Interacción
- Integración de Animación
- Diseño Automático
- Rich Text
- Event System
- Referencia UI
- Rect Transform
- Canvas Components (Componentes del Canvas)
- Componentes Visuales
- Componentes de Interacción
- Auto Layout (Diseño Automático)
- Referencia al Event System (Sistema de Eventos)
- Los cómos del UI
- Immediate Mode GUI (IMGUI)
- Navegación y Pathfinding (Búsqueda de Caminos)
- Visión General de la Navegación
- Sistema de Navegación de Unity
- Trabajos interiores del Sistema de Navegación
- Construyendo un NavMesh
- Componentes de construcción del NavMesh
- Ajustes Bake Avanzados del NavMesh
- Creando un Agente NavMesh
- Creando un NavMesh Obstacle (Obstáculo NavMesh)
- Creando un Off-mesh Link (Enlace Off-mesh)
- Construyendo Off-Mesh Links (Enlaces Off-mesh) Automáticamente
- Construyendo un Height Mesh (Mesh de altura) para una colocación precisa del personaje
- Áreas de Navegación y Costos
- Cargar Múltiples NavMeshes utilizando el Additive Loading
- Utilizando el NavMesh Agent con otros componentes
- Navigation Reference
- Los 'Cómos' de la Navegación
- Visión General de la Navegación
- Servicios de Unity
- Configurando su proyecto para Unity Services
- Unity Organizations
- Unity Ads
- Unity Analytics
- Unity Analytics Overview
- Configurando Analytics
- Analytics Dashboard
- Eventos de analítica
- Funnels
- Configuración remota
- Unity Analytics A/B Testing
- Monetization (Monetización)
- User Attributes (Atributos de Usuario)
- Unity Analytics Raw Data Export (Exportación de datos sin procesar)
- Restablecimiento de datos
- Actualizando Unity Analytics
- COPPA Compliance
- Unity Analytics and the EU General Data Protection Regulation (GDPR)
- Métricas, segmentos y terminología de Analytics
- Unity Cloud Build
- Automated Build Generation
- Supported platforms
- Versiones soportadas de Unity
- Sistemas de control de versiones
- Using the Unity Developer Dashboard to configure Unity Cloud Build for Git
- Using the Unity Editor to configure Unity Cloud Build for Git
- Using the Unity Developer Dashboard to configure Unity Cloud Build for Mercurial
- Using the Unity Editor to configure Unity Cloud Build for Mercurial
- Utilizar Apache Subversion (SVN) con Unity Cloud Build
- Using the Unity Developer Dashboard to configure Unity Cloud Build for Perforce
- Using the Unity Editor to configure Unity Cloud Build for Perforce
- Using the Unity Developer Dashboard to configure Unity Cloud Build for Plastic
- Construyendo para iOS
- Opciones Avanzadas
- Using Addressables in Unity Cloud Build
- Manifest de la construcción
- Cloud Build REST API
- Unity IAP
- Configurando el Unity IAP
- Guia Multi Plataforma
- Codeless IAP
- Definiendo productos
- Subscription Product support
- Inicialización
- Mirando Metadata del Producto
- Iniciando Compras
- Procesando Compras
- Manejando fallas en las compras
- Recuperando Transacciones
- Recibos de Compra
- Validación de Recibo
- Extensiones de la Store (tienda)
- Cross-store installation issues with Android in-app purchase stores
- Guías de Tiendas
- Implementando una Tienda
- Unity Collaborate
- Setting up Unity Collaborate
- Agregar miembros del equipo a su Proyecto de Unity
- Ver el historial
- Habilitando Cloud Build con Collaborate
- Gestión de versiones del ediitor de Unity
- Revirtiendo archivos
- Resolviendo conflictos de archivo
- Excluding Assets from publishing to Collaborate
- Publicar archivos individuales a Collaborate
- Restoring previous versions of a project
- Notificaciones de edición en progreso
- Managing cloud storage
- Moving your Project to another version control system
- Unity Accelerator
- Consejos para solucionar problemas de Collaborate
- Unity Cloud Diagnostics
- Unity Integrations
- Servicios Multiplayer
- Unity Distribution Portal
- XR
- Repositorios Open-source
- Cómo contribuir a Unity
- Paso 1: Obtener una cuenta de Bitbucket
- Paso 2: Fork el repositorio al cual usted quiere contribuir
- Step 3: Clone Su Fork
- Paso 4: Aplique las modificaciones a su fork
- Paso 5: Abra una solicitud Pull en Bitbucket
- Paso 6: Espere al Feedback (retroalimentación)
- Lecturas Adicionales
- FAQ (Preguntas más frecuentes)
- Cómo contribuir a Unity
- Asset Store Publishing
- Creating your Publisher Account
- Creating a new package draft
- Deleting a package draft
- Uploading Assets to your package
- Filling in the package details
- Submitting your package for approval
- Viewing the status of your Asset Store submissions
- Collecting revenue
- Providing support to your customers
- Adding tags to published packages
- Connecting your account to Google Analytics
- Promoting your Assets
- Refunding your customers
- Upgrading packages
- Deprecating your Assets
- Issuing vouchers
- Managing your publishing team
- Asset Store Publisher portal
- Platform development
- Using Unity as a Library in other applications
- Enabling deep linking
- Standalone
- macOS
- Apple TV
- WebGL
- WebGL Player settings
- Empezar con el desarrollo de WebGL
- Compatibilidad del navegador con WebGL
- Building and running a WebGL project
- WebGL: Deploying compressed builds
- Server configuration for WebAssembly streaming
- Debugging and troubleshooting WebGL builds
- Gráficas WebGL
- WebGL Networking (redes)
- Utilizando Audio en WebGL
- Consideraciones de rendimiento WebGL
- Embedded Resources on WebGL
- Memory in WebGL
- WebGL: Interacting with browser scripting
- Utilizando plantillas WebGL
- Bloqueo del cursor y modo de pantalla completa en WebGL
- Input en WebGL
- iOS
- Integrating Unity into native iOS applications
- Iniciando con desarrollo iOS
- iOS build settings
- iOS Player settings
- Temas Avanzados de iOS
- Troubleshooting on iOS devices
- Reportando bugs de falla en iOS
- Android
- Windows
- Integrating Unity into Windows and UWP applications
- Windows General
- Universal Windows Platform
- Cómo empezar
- Universal Windows Platform: Deployment
- Universal Windows Platform (UWP) build settings
- Windows Device Portal Deployment
- Universal Windows Platform: Profiler
- Universal Windows Platform: Command line arguments
- Universal Windows Platform: Association launching
- Clase AppCallbacks
- Universal Windows Platform: WinRT API in C# scripts
- Universal Windows Platform Player Settings
- Universal Windows Platform: IL2CPP scripting back end
- FAQ (Preguntas más frecuentes)
- Universal Windows Platform: Ejemplos
- Universal Windows Platform: Code snippets
- Known issues
- Lista de Verificación para Desarrolladores en Móviles
- Experimental
- Tópicos de legado
- Guía de mejores prácticas
- Expert guides
- Glossary
- Unity User Manual (2019.4 LTS)
- Scripting
- Herramientas de Scripting
- Debugging C# code in Unity
Debugging C# code in Unity
Using a debugger allows you to inspect your source code while your application or game is running. Unity supports debugging of C# code using the following code editors:
Visual Studio (with the Visual Studio Tools for Unity plug-in)
Visual Studio for Mac
Jetbrains Rider
Visual Studio Code
Although these code editors vary slightly in the debugger features they support, all provide basic functionality like break points, single stepping, and variable inspection.
Managed code debugging in Unity works on all platforms except WebGL. It works with both the Mono and IL2CPP scripting backends.
Configuring the code editor
Visual Studio (Windows)
The Unity Editor installer includes an option to install Visual Studio with the Visual Studio Tools for Unity plug-in. This is the recommended way to set up Visual Studio for debugging with Unity.
If Visual Studio is already installed on your computer, use its Tools > Extensions and Updates menu to locate and install the Visual Studio Tools for Unity plug-in.
Visual Studio for Mac
The Unity Editor installer includes an option to install Visual Studio for Mac. This is the recommended way to set up Visual Studio for Mac for debugging with Unity.
If Visual Studio for Mac is already installed on your computer, use its Extension Manager to locate and install the Visual Studio Tools for Unity plug-in.
JetBrains Rider
The default installation of JetBrains Rider can debug code in Unity on Windows or Mac. Please visit the JetBrains website to install it.
VS Code
VS Code requires you to install an extension to debug code in Unity. Please follow the instructions specific to this extension to install it.
Unity Preferences
When the code editor is installed, go to Unity > Preferences > External Tools and set the External Script Editor to your chosen code editor.

Debugging in the Editor
You can debug script code running in the Unity Editor when the Unity Editor is in Play Mode. Before attempting to debug, ensure the Editor Attaching option is enabled in the Unity Preferences. This option causes the Editor to use Just In Time (JIT) compilation to execute managed code with debugging information.
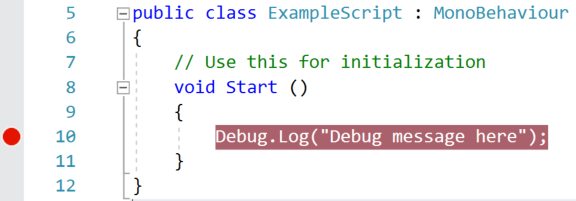
First, set a breakpoint in the code editor on a line of script code where the debugger should stop. In Visual Studio for example, click on the column to the left of your code, on the line you want to stop the debugger (as shown below). A red circle appears next to the line number and the line is highlighted.
Next, attach the code editor to the Unity Editor. This option varies depending on the code editor, and is often a different option from the code editor’s normal debugging process. In Visual Studio, the option looks like this:

Some code editors may allow you to select an instance of Unity to debug. For example, in Visual Studio, the Debug > Attach Unity Debugger option exposes this capability.
When you have attached the code editor to the Unity Editor, return to the Unity Editor and enter Play Mode. When the code at the breakpoint is executed, the debugger will stop, for example:
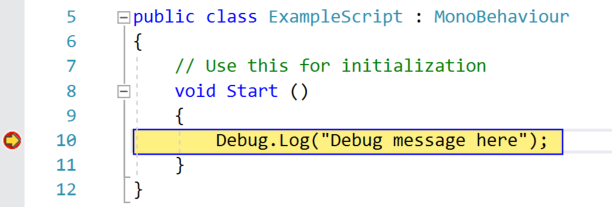
While the code editor is at a breakpoint, you can view the contents of variables step by step. The Unity Editor will be unresponsive until you choose the continue option in the debugger, or stop debugging mode.
Debugging in the Player
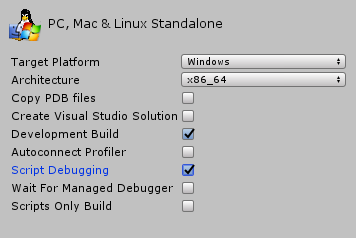
To debug script code running in a Unity Player, ensure that you enable the “Development Build” and “Script Debugging” options before you build the Player (these options are located in File > Build Settings). Enable the “Wait For Managed Debugger” option to make the Player wait for a debugger to be attached before it executes any script code.
To attach the code editor to the Unity Player, select the IP address (or machine name) and port of your Player. In Visual Studio, the drop-down menu on the “Attach To Unity” option looks like this:

The Debug > Attach Unity Debugger option looks like this:

Make sure you attach the debugger to the Player, and not to the Unity Editor (if both are running). When you have attached the debugger, you can proceed with debugging normally.
Debugging on Android and iOS devices
Android
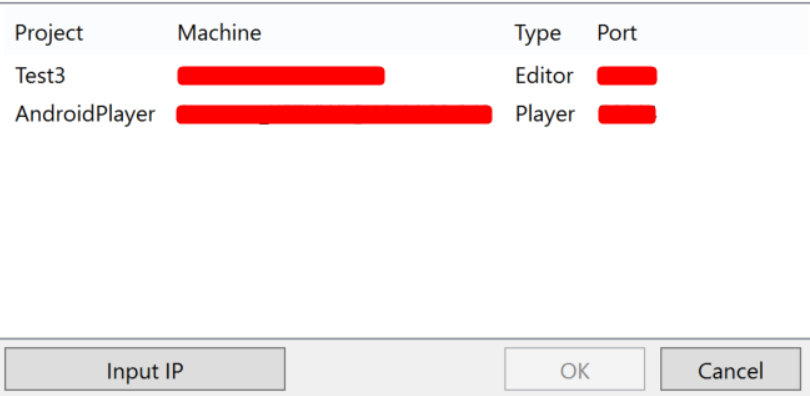
When debugging a Player running on an Android device, connect to the device via USB or TCP. For example, to connect to an Android device in Visual Studio (Windows), select Debug > Attach Unity Debugger option. A list of devices running a Player instance will appear:

In this case, the phone is connected via USB and Wi-Fi on the same network as the workstation running the Unity Editor and Visual Studio.
iOS
When debugging a Player running on an iOS device, connect to the device via TCP. For example, to connect to an iOS device in Visual Studio (Mac), select Debug > Attach Unity Debugger option. A list of devices running a Player instance will appear:
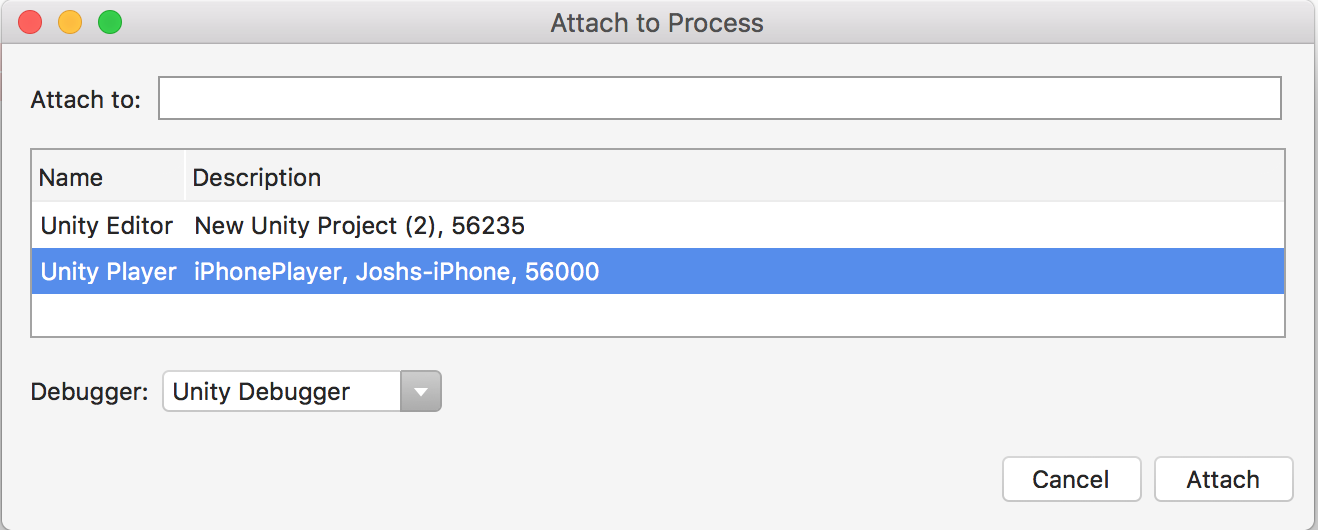
Ensure that the device only has one active network interface (Wi-Fi recommended, turn off cellular data) and that there is no firewall between the IDE and the device blocking the TCP port (port number 56000 in the above screenshot). Debugging over USB is not supported with iOS.
Troubleshooting the debugger
Most problems with the debugger occur because the code editor is unable to locate the Unity Editor or the Player. This means that it can’t attach the debugger properly. Because the debugger uses a TCP connection to the Editor or Player, connection issues are often caused by the network. Here are a few steps you can take to troubleshoot basic connection issues.
Ensure you attach the debugger to the correct Unity instance
You can attach code editor to any Unity Editor or Unity Player on the local network that has debugging enabled. When attaching the debugger to ensure that you are attaching to the correct instance. If you know the IP address or machine name of the device on which you are running the Unity Player, this helps to locate the correct instance.
Verify the network connection to the Unity instance
The code editor uses the same mechanism to locate a Unity instance to debug as the Unity Profiler uses. If the code editor cannot find the Unity instance you expect it to find, try to attach the Unity Profiler to that instance. If the Unity Profiler cannot find it either, a firewall might exist on the machine which you are running the code editor on or the machine which you are running the Unity instance on (or possibly both). If a firewall is in place, see the information about firewall settings below.
Ensure the device has only one active network interface
Many devices have multiple network interfaces. For example, a mobile phone may have both an active cellular connection and an active Wi-Fi connection. To properly connect the debugger for TCP, the IDE needs to make a network connection to the correct interface on the device. If you plan to debug via Wi-Fi, for example, make sure you put the device in airplane mode to disable all other interfaces, then enable Wi-Fi.
You can determine which IP address the Unity Player is telling the IDE to use by looking in the Player Log. Look for a part of the log like this:
Multi-casting "[IP] 10.0.1.152 [Port] 55000 [Flags] 3 [Guid] 2575380029 [EditorId] 4264788666 [Version] 1048832 [Id] iPhonePlayer(Joshs-iPhone):56000 [Debug] 1 [PackageName] iPhonePlayer" to [225.0.0.222:54997]...
This message indicates the IDE will try to use the IP address 10.0.1.152 and port 56000 to connect to the device. This IP address and port must be reachable from the computer running the IDE.
Check the firewall settings
The Unity instance communicates with the code editor via a TCP connection. On most Unity platforms, this TCP connection occurs on an arbitrarily chosen port. Normally, you should not need to know this port, as the code editor should detect it automatically. If that does not work, try to use a network analysis tool to determine which ports might be blocked either on the machine where you are running the code editor, or the machine or device where you are running the Unity instance. When you find the ports, make sure that your firewall allows access to both the port on the machine running the code editor, and the machine running the Unity instance.
Verify the managed debugging information is available
If the debugger does attach, but breakpoints don’t load, the debugger may not be able to locate the managed debugging information for the code. Managed code debugging information is stored in files named .pdb, next to the managed assembly (.dll file) on disk.
When the correct preferences and build options are enabled (see above, Unity will generate this debugging information automatically. However, Unity cannot generate this debugging information for managed plugins in the Project. It is possible to debug code from managed plugins if the associated .pdb files are next to the managed plugins in the Unity project on disk.
Prevent the device from locking
If the device you are using to debug the application has a screen lock, make sure this is disabled. Screen locks cause the debugger to disconnect, and prevent it from re-connecting. It is best to avoid locking the screen during managed code debugging. If the screen does lock, you should restart the application on the device before the debugger can connect again.
2018–09–06 Page published
Managed Code Debugging added in 2018.2