Manual
- Unity User Manual (2020.1)
- Packages
- Verified packages
- 2D Animation
- 2D Pixel Perfect
- 2D PSD Importer
- 2D SpriteShape
- Adaptive Performance
- Adaptive Performance Samsung Android
- Addressables
- Advertisement
- Alembic
- Analytics Library
- Android Logcat
- AR Foundation
- ARCore XR Plugin
- ARKit Face Tracking
- ARKit XR Plugin
- Burst
- Cinemachine
- Editor Coroutines
- High Definition RP
- In App Purchasing
- Input System
- JetBrains Rider Editor
- Magic Leap XR Plugin
- ML Agents
- Mobile Notifications
- Multiplayer HLAPI
- Oculus XR Plugin
- Polybrush
- Post Processing
- ProBuilder
- Profile Analyzer
- Quick Search
- Remote Config
- Scriptable Build Pipeline
- Shader Graph
- Test Framework
- TextMeshPro
- Timeline
- Unity Collaborate
- Unity Distribution Portal
- Unity Recorder
- Universal RP
- Visual Effect Graph
- Visual Studio Code Editor
- Visual Studio Editor
- Windows XR Plugin
- Xiaomi SDK
- XR Plugin Management
- Preview packages
- Core packages
- Built-in packages
- AI
- Android JNI
- Animation
- Asset Bundle
- Audio
- Cloth
- Director
- Image Conversion
- IMGUI
- JSONSerialize
- Particle System
- Physics
- Physics 2D
- Screen Capture
- Terrain
- Terrain Physics
- Tilemap
- UI
- UIElements
- Umbra
- Unity Analytics
- Unity Web Request
- Unity Web Request Asset Bundle
- Unity Web Request Audio
- Unity Web Request Texture
- Unity Web Request WWW
- Vehicles
- Video
- VR
- Wind
- XR
- Packages by keywords
- Unity's Package Manager
- Creating custom packages
- Verified packages
- Working in Unity
- Installing Unity
- Upgrading Unity
- Using the API Updater
- Upgrading to Unity 2020.2
- Upgrading to Unity 2020.1
- Upgrading to Unity 2019 LTS
- Upgrading to Unity 2018 LTS
- Legacy Upgrade Guides
- Unity's interface
- Asset workflow
- Создание геймплея.
- Editor Features
- 2D and 3D mode settings
- Preferences
- Presets
- Shortcuts Manager
- Build Settings
- Project Settings
- Visual Studio C# integration
- RenderDoc Integration
- Using the Xcode frame debugger
- Editor Analytics
- Проверка обновлений
- IME в Unity
- Специальные Папки Проекта
- Reusing Assets between Projects
- Version Control
- Multi-Scene editing
- Command line arguments
- Support for custom Menu Item and Editor features
- Text-Based Scene Files
- Решение проблем в редакторе
- Analysis
- Importing
- Input
- 2D
- Геймплей в 2D
- 2D Sorting
- Sprites
- Tilemap
- Physics Reference 2D
- Графика
- Render pipelines
- Built-in Render Pipeline
- Universal Render Pipeline
- High Definition Render Pipeline
- Scriptable Render Pipeline
- Scriptable Render Pipeline introduction
- Creating a custom Scriptable Render Pipeline
- Creating a Render Pipeline Asset and Render Pipeline Instance
- Setting the active Render Pipeline Asset
- Creating a simple render loop in a custom Scriptable Render Pipeline
- Scheduling and executing rendering commands in the Scriptable Render Pipeline
- Scriptable Render Pipeline (SRP) Batcher
- Cameras
- Post-processing
- Lighting
- Introduction to lighting
- Light sources
- Shadows
- The Lighting window
- Lighting Settings Asset
- The Light Explorer window
- Lightmapping
- The Progressive Lightmapper
- Lightmapping using Enlighten (deprecated)
- Lightmapping: Getting started
- Lightmap Parameters Asset
- Directional Mode
- Lightmaps and LOD
- Ambient occlusion
- Lightmaps: Technical information
- Lightmapping and the Shader Meta Pass
- Lightmap UVs
- UV overlap
- Lightmap seam stitching
- Custom fall-off
- Realtime Global Illumination using Enlighten (deprecated)
- Light Probes
- Reflection Probes
- Precomputed lighting data
- Scene View Draw Modes for lighting
- Meshes, Materials, Shaders and Textures
- Mesh Components
- Materials
- Текстуры
- Writing Shaders
- Standard Shader
- Standard Particle Shaders
- Autodesk Interactive shader
- Legacy Shaders
- Shader Reference
- Writing Surface Shaders
- Writing vertex and fragment shaders
- Примеры вершинных и фрагментных шейдеров
- Shader semantics
- Accessing shader properties in Cg/HLSL
- Providing vertex data to vertex programs
- Встроенные подключаемые файлы для шейдеров
- Стандартные шейдерные предпроцессорные макросы
- Built-in shader helper functions
- Built-in shader variables
- Shader variants and keywords
- GLSL Shader programs
- Shading language used in Unity
- Shader Compilation Target Levels
- Shader data types and precision
- Using sampler states
- Синтаксис ShaderLab: Shader
- Синтаксис ShaderLab: свойства
- Синтаксис ShaderLab: SubShader
- Синтаксис ShaderLab: Pass
- ShaderLab culling and depth testing
- Синтаксис ShaderLab: Blending
- Синтаксис ShaderLab: тэги Pass
- Синтаксис ShaderLab: Stencil
- Синтаксис ShaderLab: Name
- Синтаксис ShaderLab: цвет, материал, освещение
- ShaderLab: Legacy Texture Combiners
- Синтакс ShaderLab: Альфа тестинг (Alpha testing)
- Синтаксис ShaderLab: туман
- Синтаксис ShaderLab: BindChannels
- Синтаксис ShaderLab: UsePass
- Синтаксис ShaderLab: GrabPass
- ShaderLab: SubShader Tags
- Синтаксис ShaderLab: Pass
- Синтаксис ShaderLab: Fallback
- #Синтаксис ShaderLab: CustomEditor
- Синтаксис ShaderLab: другие команды
- Shader assets
- Расширенные возможности ShaderLab
- Optimizing shader variants
- Asynchronous Shader compilation
- Performance tips when writing shaders
- Rendering with Replaced Shaders
- Custom Shader GUI
- Использование текстур глубины
- Текстура глубины камеры
- Особенности рендеринга различных платформ
- ShaderLab: SubShader LOD value
- Using texture arrays in shaders
- Debugging DirectX 11/12 shaders with Visual Studio
- Debugging DirectX 12 shaders with PIX
- Implementing Fixed Function TexGen in Shaders
- Tutorial: ShaderLab and fixed function shaders
- Tutorial: vertex and fragment programs
- Particle systems
- Choosing your particle system solution
- Built-in Particle System
- Using the Built-in Particle System
- Particle System vertex streams and Standard Shader support
- Particle System GPU Instancing
- Particle System C# Job System integration
- Components and Modules
- Particle System
- Particle System modules
- Particle System Main module
- Emission module
- Shape Module
- Velocity over Lifetime module
- Noise module
- Limit Velocity Over Lifetime module
- Inherit Velocity module
- Lifetime by Emitter Speed
- Force Over Lifetime module
- Color Over Lifetime module
- Color By Speed module
- Size over Lifetime module
- Size by Speed module
- Rotation Over Lifetime module
- Rotation By Speed module
- External Forces module
- Collision module
- Triggers module
- Sub Emitters module
- Texture Sheet Animation module
- Lights module
- Trails module
- Custom Data module
- Renderer module
- Particle System Force Field
- Built-in Particle System examples
- Visual Effect Graph
- Creating environments
- Sky
- Visual Effects Components
- Advanced rendering features
- High dynamic range
- Level of Detail (LOD) for meshes
- Graphics API support
- Streaming Virtual Texturing
- Streaming Virtual Texturing requirements and compatibility
- How Streaming Virtual Texturing works
- Enabling Streaming Virtual Texturing in your project
- Using Streaming Virtual Texturing in Shader Graph
- Cache Management for Virtual Texturing
- Marking textures as "Virtual Texturing Only"
- Virtual Texturing error material
- Compute shaders
- GPU instancing
- Делимые текстуры (Sparse Textures)
- CullingGroup API
- Loading texture and mesh data
- Оптимизация производительности графики
- Color space
- Graphics tutorials
- Как мне исправить вращение импортированной модели?
- Art Asset best practice guide
- Importing models from 3D modeling software
- Making believable visuals in Unity
- Update: believable visuals in URP and HDRP
- Believable visuals: preparing assets
- Believable visuals: render settings
- Believable visuals: lighting strategy
- Believable visuals: models
- Believable visuals: materials and shaders
- Believable visuals: outdoor lighting
- Believable visuals: indoor and local lighting
- Believable visuals: post-processing
- Believable visuals: dynamic lighting
- Setting up the Rendering Pipeline and Lighting in Unity
- Render pipelines
- Physics
- Scripting
- Setting Up Your Scripting Environment
- Scripting concepts
- Important Classes
- Important Classes - GameObject
- Important Classes - MonoBehaviour
- Important Classes - Object
- Important Classes - Transform
- Important Classes - Vectors
- Important Classes - Quaternion
- ScriptableObject
- Important Classes - Time and Framerate Management
- Important Classes - Mathf
- Important Classes - Random
- Important Classes - Debug
- Important Classes - Gizmos & Handles
- Unity architecture
- Plug-ins
- C# Job System
- Multiplayer and Networking
- Multiplayer Overview
- Setting up a multiplayer project
- Using the Network Manager
- Using the Network Manager HUD
- The Network Manager HUD in LAN mode
- The Network Manager HUD in Matchmaker mode
- Converting a single-player game to Unity Multiplayer
- Debugging Information
- The Multiplayer High Level API
- Multiplayer Component Reference
- Multiplayer Classes Reference
- Multiplayer Encryption Plug-ins
- UnityWebRequest
- Аудио
- Аудио. Обзор.
- Аудио файлы
- Трекерные модули
- Audio Mixer
- Native Audio Plugin SDK
- Audio Profiler
- Ambisonic Audio
- Справочник по аудио
- Audio Clip
- Audio Listener
- Audio Source
- Audio Mixer
- Аудио эффекты (только для Pro версии)
- Audio Effects
- Audio Low Pass Effect
- Audio High Pass Effect
- Audio Echo Effect
- Audio Flange Effect
- Audio Distortion Effect
- Audio Normalize Effect
- Audio Parametric Equalizer Effect
- Audio Pitch Shifter Effect
- Audio Chorus Effect
- Audio Compressor Effect
- Audio SFX Reverb Effect
- Audio Low Pass Simple Effect
- Audio High Pass Simple Effect
- Reverb Zones
- Микрофон
- Audio Settings
- Video overview
- Анимация
- Animation System Overview
- Анимационные клипы
- Animator Controllers (контроллеры аниматоров)
- Аниматор и контроллер аниматора
- The Animator Window
- Конечные автоматы в анимации
- Blend Trees (Деревья смешивания)
- Working with blend shapes
- Animator Override Controllers
- Переназначение гуманоидных анимаций
- Performance and optimization
- Animation Reference
- Кривые анимации и события
- Playables API
- Словарь терминов анимации и Mecanim.
- Creating user interfaces (UI)
- Comparison of UI systems in Unity
- UI Toolkit
- Unity UI
- Сanvas (Полотно)
- Basic Layout
- Визуальные компоненты
- Компоненты взаимодействия
- Animation Integration
- Auto Layout
- Rich Text
- Event System
- Справка по пользовательским интерфейсам
- Rect Transform
- Canvas Components
- Visual Components
- Interaction Components
- Auto Layout
- Справка по системе событий
- Практические рекомендации по работе с UI (пользовательскими интерфейсами)
- Immediate Mode GUI (IMGUI)
- Навигация и поиск пути
- Navigation Overview
- Navigation System in Unity
- Inner Workings of the Navigation System
- Building a NavMesh
- NavMesh building components
- Advanced NavMesh Bake Settings
- Creating a NavMesh Agent
- Creating a NavMesh Obstacle
- Creating an Off-mesh Link
- Building Off-Mesh Links Automatically
- Building Height Mesh for Accurate Character Placement
- Navigation Areas and Costs
- Loading Multiple NavMeshes using Additive Loading
- Using NavMesh Agent with Other Components
- Справочник по навигации
- Navigation How-Tos
- Navigation Overview
- Unity Services
- Setting up your project for Unity services
- Unity Organizations
- Unity Ads
- Unity Analytics
- Unity Analytics Overview
- Setting Up Analytics
- Analytics Dashboard
- Analytics events
- Funnels
- Remote Settings
- Unity Analytics A/B Testing
- Monetization
- User Attributes
- Unity Analytics Raw Data Export
- Data reset
- Upgrading Unity Analytics
- COPPA Compliance
- Unity Analytics and the EU General Data Protection Regulation (GDPR)
- Analytics Metrics, Segments, and Terminology
- Unity Cloud Build
- Automated Build Generation
- Supported platforms
- Supported versions of Unity
- Share links
- Version control systems
- Using the Unity Developer Dashboard to configure Unity Cloud Build for Git
- Using the Unity Developer Dashboard to configure Unity Cloud Build for Mercurial
- Using Apache Subversion (SVN) with Unity Cloud Build
- Using the Unity Developer Dashboard to configure Unity Cloud Build for Perforce
- Using the Unity Developer Dashboard to configure Unity Cloud Build for Plastic
- Building for iOS
- Advanced options
- Using Addressables in Unity Cloud Build
- Build manifest
- Scheduled builds
- Cloud Build REST API
- Unity Cloud Content Delivery
- Unity IAP
- Setting up Unity IAP
- Cross Platform Guide
- Codeless IAP
- Defining products
- Subscription Product support
- Initialization
- Browsing Product Metadata
- Initiating Purchases
- Processing Purchases
- Handling purchase failures
- Restoring Transactions
- Purchase Receipts
- Receipt validation
- Store Extensions
- Cross-store installation issues with Android in-app purchase stores
- Store Guides
- Implementing a Store
- Unity Collaborate
- Setting up Unity Collaborate
- Adding team members to your Unity project
- Viewing history
- Enabling Cloud Build with Collaborate
- Managing Unity Editor versions
- Reverting files
- Resolving file conflicts
- Excluding Assets from publishing to Collaborate
- Publishing individual files to Collaborate
- Restoring previous versions of a project
- In-Progress edit notifications
- Managing cloud storage
- Moving your Project to another version control system
- Unity Accelerator
- Collaborate troubleshooting tips
- Unity Cloud Diagnostics
- Unity Integrations
- Multiplayer Services
- Unity Distribution Portal
- XR
- Getting started with AR development in Unity
- Getting started with VR development in Unity
- XR Plug-in Framework
- Configuring your Unity Project for XR
- Universal Render Pipeline compatibility in XR
- XR API reference
- Single Pass Stereo rendering (Double-Wide rendering)
- VR Audio Spatializers
- VR frame timing
- Unity XR SDK
- Open-source repositories
- Asset Store Publishing
- Creating your Publisher Account
- Creating a new package draft
- Deleting a package draft
- Uploading Assets to your package
- Filling in the package details
- Submitting your package for approval
- Viewing the status of your Asset Store submissions
- Collecting revenue
- Providing support to your customers
- Adding tags to published packages
- Connecting your account to Google Analytics
- Promoting your Assets
- Refunding your customers
- Upgrading packages
- Deprecating your Assets
- Issuing vouchers
- Managing your publishing team
- Asset Store Publisher portal
- Platform development
- Using Unity as a Library in other applications
- Enabling deep linking
- Автономный
- macOS
- Apple TV
- WebGL
- Getting started with WebGL development
- WebGL Player settings
- Building and running a WebGL project
- WebGL: Compressed builds and server configuration
- WebGL: Server configuration code samples
- WebGL Browser Compatibility
- WebGL Graphics
- Using Audio In WebGL
- Embedded Resources on WebGL
- Using WebGL templates
- Cursor locking and full-screen mode in WebGL
- Input in WebGL
- WebGL: Interacting with browser scripting
- WebGL performance considerations
- Memory in WebGL
- Debugging and troubleshooting WebGL builds
- WebGL Networking
- Getting started with WebGL development
- iOS
- Integrating Unity into native iOS applications
- Первые шаги в iOS разработке
- iOS build settings
- iOS Player settings
- Продвинутые темы по iOS
- Troubleshooting on iOS devices
- Сообщение об ошибках, приводящих к "падениям" на iOS
- Android
- Android environment setup
- Integrating Unity into Android applications
- Unity Remote
- Android Player settings
- Android Keystore Manager
- Building apps for Android
- Single-Pass Stereo Rendering for Android
- Building and using plug-ins for Android
- Android mobile scripting
- Troubleshooting Android development
- Reporting crash bugs under Android
- Windows
- Integrating Unity into Windows and UWP applications
- Windows General
- Universal Windows Platform
- Приложения Windows Store: Приступая к работе
- Universal Windows Platform: Deployment
- Universal Windows Platform (UWP) build settings
- Windows Device Portal Deployment
- Universal Windows Platform: Profiler
- Universal Windows Platform: Command line arguments
- Universal Windows Platform: Association launching
- Класс AppCallbacks
- Universal Windows Platform: WinRT API in C# scripts
- Universal Windows Platform Player Settings
- Universal Windows Platform: IL2CPP scripting back end
- ЧаВо
- Universal Windows Platform: Examples
- Universal Windows Platform: Code snippets
- Known issues
- Чеклист Мобильного Разработчика
- Experimental
- Legacy Topics
- Expert guides
- New in Unity 2020.1
- Glossary
- Unity User Manual (2020.1)
- Scripting
- Setting Up Your Scripting Environment
- Debugging C# code in Unity
Debugging C# code in Unity
Using a debugger allows you to inspect your source code while your application or game is running. Unity supports debugging of C# code using the following code editors:
Visual Studio (with the Visual Studio Tools for Unity plug-in)
Visual Studio for Mac
Jetbrains Rider
Visual Studio Code
Although these code editors vary slightly in the debugger features they support, all provide basic functionality like break points, single stepping, and variable inspection.
Managed code debugging in Unity works on all platforms except WebGL. It works with both the Mono and IL2CPP scripting backends.
Configuring the code editor
Visual Studio (Windows)
The Unity Editor installer includes an option to install Visual Studio with the Visual Studio Tools for Unity plug-in. This is the recommended way to set up Visual Studio for debugging with Unity.
If Visual Studio is already installed on your computer, use its Tools > Extensions and Updates menu to locate and install the Visual Studio Tools for Unity plug-in.
Visual Studio for Mac
The Unity Editor installer includes an option to install Visual Studio for Mac. This is the recommended way to set up Visual Studio for Mac for debugging with Unity.
If Visual Studio for Mac is already installed on your computer, use its Extension Manager to locate and install the Visual Studio Tools for Unity plug-in.
JetBrains Rider
The default installation of JetBrains Rider can debug code in Unity on Windows or Mac. Please visit the JetBrains website to install it.
VS Code
VS Code requires you to install an extension to debug code in Unity. Please follow the instructions specific to this extension to install it.
Specifying the External Script Editor in Unity
Once you’ve installed a code editor, go to Preferences > External Tools and set the External Script Editor to your chosen code editor.

Debugging in the Editor
You can debug C# code that is running in the Unity Editor while the Unity Editor is in Play Mode.
To debug in the Editor, you need to set the Editor’s Code Optimization mode to Debug Mode, then you can attach a code editor with a debugging feature.
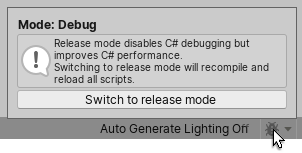
To change the Code Optimization mode, select the Debug Button in the bottom right of the Unity Editor Status Bar.

Unity’s Code Optimization setting has two modes.
- Debug Mode, which you can use to attach external debugger software, but gives slower C# performance when you run your Project in Play Mode in the Editor.
- Release Mode, which gives faster C# performance when you run your Project in Play Mode in the Editor, but you cannot attach any external debuggers.
When you click the Debug button in the status bar, a small pop-up window opens which contains a button you can use to switch modes. It also displays information about the current mode, and describes what happens if you switch modes.
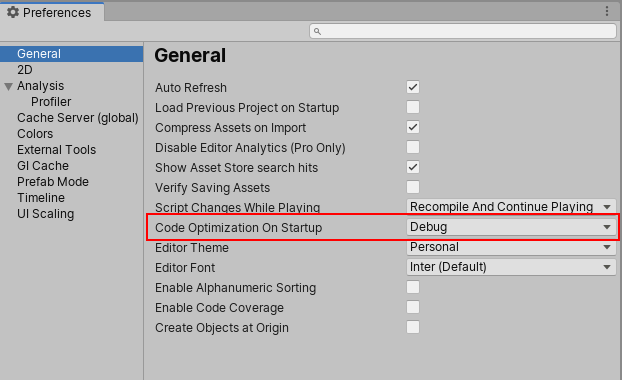
To change which mode the Unity Editor starts up in, go to Edit > Preferences > General > Code Optimization On Startup.
To control these settings via a script, use the following API: ManagedDebugger, Compilation.CompilationPipeline-codeOptimization, and Compilation.CodeOptimization.
You can also override the mode that the Editor starts up in, or turn off the debugger listen socket. To do this, use the following command line arguments when you launch the Editor:
-
-releaseCodeOptimizationStarts the Editor in release code optimization mode. -
-debugCodeOptimizationStarts the Editor in debug code optimization mode. -
-disableManagedDebuggerStarts the Editor with the debugger listen socket disabled.
Setting breakpoints and attaching to the Editor
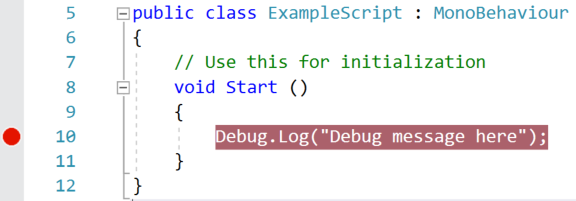
In your external code editor, set a breakpoint in the code editor on a line of script code where the debugger should stop. For example, in Visual Studio, click on the column to the left of your code, on the line you want to stop the debugger (as shown below). A red circle appears next to the line number and the line is highlighted.
Next, attach the code editor to the Unity Editor. This option varies depending on the code editor, and is often a different option from the code editor’s normal debugging process. In Visual Studio, the option looks like this:

Some code editors may allow you to select an instance of Unity to debug. For example, in Visual Studio, the Debug > Attach Unity Debugger option exposes this capability.
When you have attached the code editor to the Unity Editor, return to the Unity Editor and enter Play Mode. When the code at the breakpoint is executed, the debugger will stop, for example:
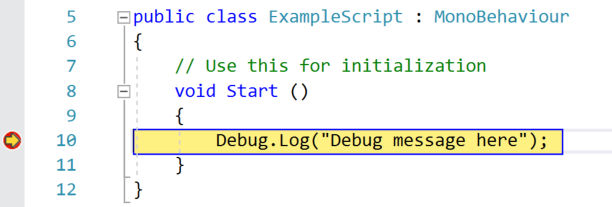
While the code editor is at a breakpoint, you can view the contents of variables step by step. The Unity Editor will be unresponsive until you choose the continue option in the debugger, or stop debugging mode.
Debugging in the Player
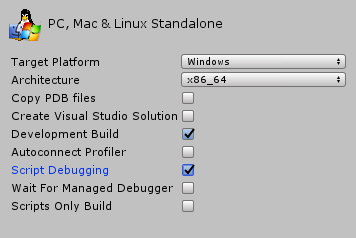
To debug script code running in a Unity Player, ensure that you enable the “Development Build” and “Script Debugging” options before you build the Player (these options are located in File > Build Settings). Enable the “Wait For Managed Debugger” option to make the Player wait for a debugger to be attached before it executes any script code.
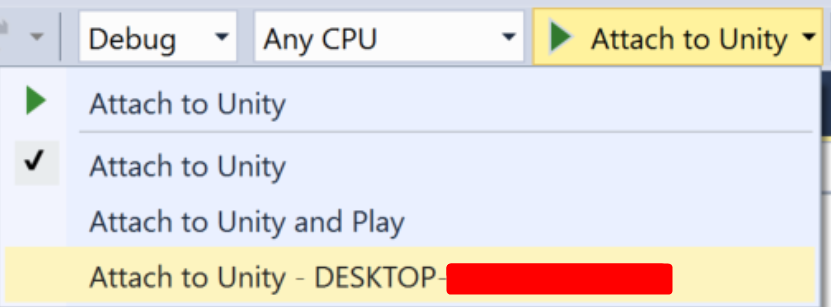
To attach the code editor to the Unity Player, select the IP address (or machine name) and port of your Player. In Visual Studio, the drop-down menu on the “Attach To Unity” option looks like this:
The Debug > Attach Unity Debugger option looks like this:
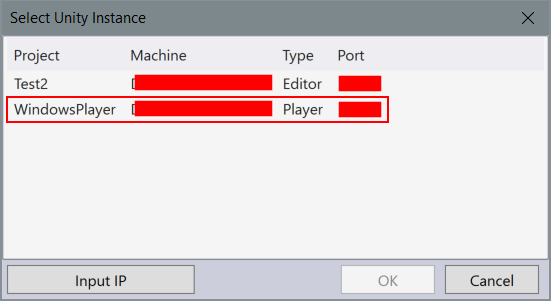
Make sure you attach the debugger to the Player, and not to the Unity Editor (if both are running). When you have attached the debugger, you can proceed with debugging normally.
Debugging on Android and iOS devices
Android
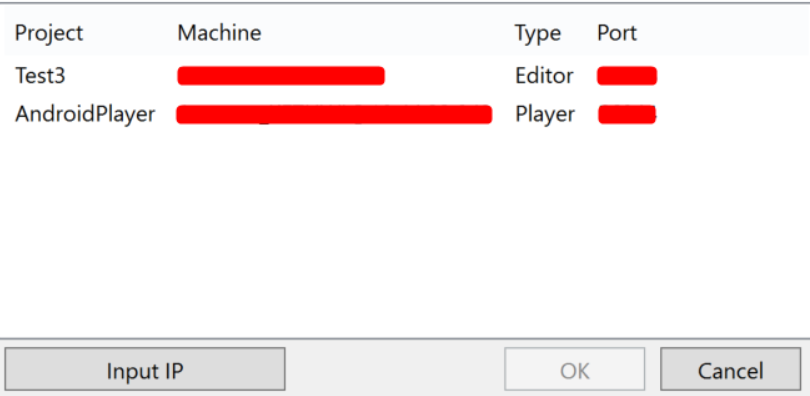
When debugging a Player running on an Android device, connect to the device via USB or TCP. For example, to connect to an Android device in Visual Studio (Windows), select Debug > Attach Unity Debugger option. A list of devices running a Player instance will appear:
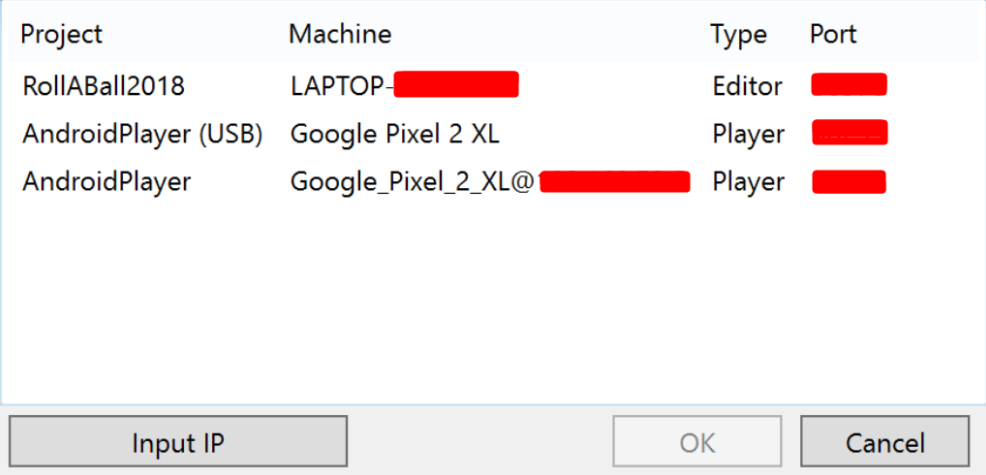
In this case, the phone is connected via USB and Wi-Fi on the same network as the workstation running the Unity Editor and Visual Studio.
iOS
When debugging a Player running on an iOS device, connect to the device via TCP. For example, to connect to an iOS device in Visual Studio (Mac), select Debug > Attach Unity Debugger option. A list of devices running a Player instance will appear:
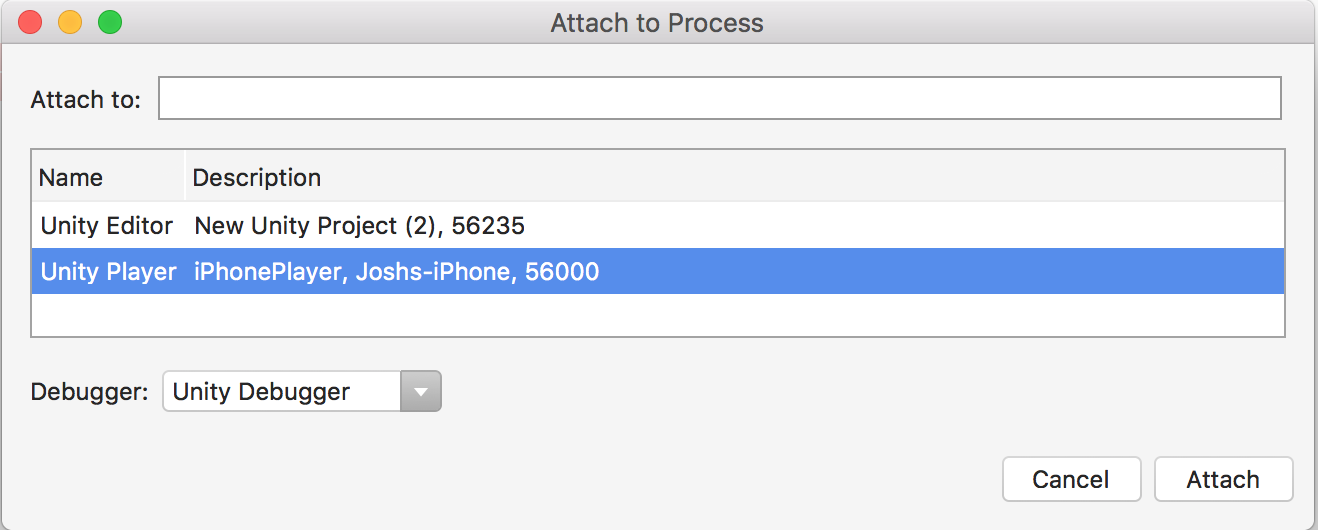
Ensure that the device only has one active network interface (Wi-Fi recommended, turn off cellular data) and that there is no firewall between the IDE and the device blocking the TCP port (port number 56000 in the above screenshot). Debugging over USB is not supported with iOS.
Troubleshooting the debugger
Most problems with the debugger occur because the code editor is unable to locate the Unity Editor or the Player. This means that it can’t attach the debugger properly. Because the debugger uses a TCP connection to the Editor or Player, connection issues are often caused by the network. Here are a few steps you can take to troubleshoot basic connection issues.
Ensure you attach the debugger to the correct Unity instance
You can attach code editor to any Unity Editor or Unity Player on the local network that has debugging enabled. When attaching the debugger to ensure that you are attaching to the correct instance. If you know the IP address or machine name of the device on which you are running the Unity Player, this helps to locate the correct instance.
Verify the network connection to the Unity instance
The code editor uses the same mechanism to locate a Unity instance to debug as the Unity Profiler uses. If the code editor cannot find the Unity instance you expect it to find, try to attach the Unity Profiler to that instance. If the Unity Profiler cannot find it either, a firewall might exist on the machine which you are running the code editor on or the machine which you are running the Unity instance on (or possibly both). If a firewall is in place, see the information about firewall settings below.
Ensure the device has only one active network interface
Many devices have multiple network interfaces. For example, a mobile phone may have both an active cellular connection and an active Wi-Fi connection. To properly connect the debugger for TCP, the IDE needs to make a network connection to the correct interface on the device. If you plan to debug via Wi-Fi, for example, make sure you put the device in airplane mode to disable all other interfaces, then enable Wi-Fi.
You can determine which IP address the Unity Player is telling the IDE to use by looking in the Player Log. Look for a part of the log like this:
Multi-casting "[IP] 10.0.1.152 [Port] 55000 [Flags] 3 [Guid] 2575380029 [EditorId] 4264788666 [Version] 1048832 [Id] iPhonePlayer(Joshs-iPhone):56000 [Debug] 1 [PackageName] iPhonePlayer" to [225.0.0.222:54997]...
This message indicates the IDE will try to use the IP address 10.0.1.152 and port 56000 to connect to the device. This IP address and port must be reachable from the computer running the IDE.
Check the firewall settings
The Unity instance communicates with the code editor via a TCP connection. On most Unity platforms, this TCP connection occurs on an arbitrarily chosen port. Normally, you should not need to know this port, as the code editor should detect it automatically. If that does not work, try to use a network analysis tool to determine which ports might be blocked either on the machine where you are running the code editor, or the machine or device where you are running the Unity instance. When you find the ports, make sure that your firewall allows access to both the port on the machine running the code editor, and the machine running the Unity instance.
Verify the managed debugging information is available
If the debugger does attach, but breakpoints don’t load, the debugger may not be able to locate the managed debugging information for the code. Managed code debugging information is stored in files named .pdb, next to the managed assembly (.dll file) on disk.
When the correct preferences and build options are enabled (see above, Unity will generate this debugging information automatically. However, Unity cannot generate this debugging information for managed plugins in the Project. It is possible to debug code from managed plugins if the associated .pdb files are next to the managed plugins in the Unity project on disk.
Prevent the device from locking
If the device you are using to debug the application has a screen lock, make sure this is disabled. Screen locks cause the debugger to disconnect, and prevent it from re-connecting. It is best to avoid locking the screen during managed code debugging. If the screen does lock, you should restart the application on the device before the debugger can connect again.
2018–09–06 Page published
Managed Code Debugging added in 2018.2