Unity Manual
- Unity User Manual 2023.2
- New in Unity 2023.2
- Packages and feature sets
- Released packages
- 2D Animation
- 2D Aseprite Importer
- 2D Pixel Perfect
- 2D PSD Importer
- 2D SpriteShape
- 2D Tilemap Extras
- Adaptive Performance
- Addressables
- Addressables for Android
- Ads Mediation
- Advertisement Legacy
- AI Navigation
- Alembic
- Analytics
- Android Logcat
- Animation Rigging
- Apple ARKit XR Plugin
- AR Foundation
- Authentication
- Build Automation
- Burst
- CCD Management
- Cinemachine
- Cloud Diagnostics
- Cloud Save
- Code Coverage
- Collections
- Deployment
- Device Simulator Devices
- Economy
- Editor Coroutines
- FBX Exporter
- Friends
- Google ARCore XR Plugin
- In App Purchasing
- Input System
- iOS 14 Advertising Support
- JetBrains Rider Editor
- Leaderboards
- Live Capture
- Lobby
- Localization
- Magic Leap XR Plugin
- Matchmaker
- Mathematics
- Memory Profiler
- ML Agents
- Mobile Notifications
- Multiplayer Tools
- Netcode for GameObjects
- Oculus XR Plugin
- OpenXR Plugin
- Player Accounts
- Polybrush
- Post Processing
- ProBuilder
- Profile Analyzer
- Push Notifications
- Python Scripting
- Recorder
- Relay
- Remote Config
- Scriptable Build Pipeline
- Sequences
- Splines
- Sysroot Base
- Sysroot Linux x64
- System Metrics Mali
- Terrain Tools
- Test Framework
- Timeline
- Toolchain Linux x64
- Toolchain MacOS Linux x64
- Toolchain Win Linux x64
- Tutorial Authoring Tools
- Tutorial Framework
- Unity Distribution Portal
- Unity OpenXR Meta
- Unity Profiling Core API
- Unity Transport
- User Generated Content
- User Generated Content Bridge
- User Reporting
- Version Control
- Visual Scripting
- Visual Studio Editor
- WebGL Publisher
- XR Hands
- XR Interaction Toolkit
- XR Plugin Management
- ZivaRT Player
- Release candidates
- Pre-release packages
- Core packages
- Built-in packages
- Accessibility
- AI
- Android JNI
- Animation
- Asset Bundle
- Audio
- Cloth
- Director
- Image Conversion
- IMGUI
- JSONSerialize
- NVIDIA
- Particle System
- Physics
- Physics 2D
- Screen Capture
- Terrain
- Terrain Physics
- Tilemap
- UI
- UIElements
- Umbra
- Unity Analytics
- Unity Web Request
- Unity Web Request Asset Bundle
- Unity Web Request Audio
- Unity Web Request Texture
- Unity Web Request WWW
- Vehicles
- Video
- VR
- Wind
- XR
- Experimental packages
- Packages by keywords
- Deprecated packages
- Unity's Package Manager
- How Unity works with packages
- Concepts
- Configuration
- Package Manager window
- Access the Package Manager window
- Navigation panel
- List panel
- Details panel
- Features (details panel)
- Finding packages and feature sets
- Add and remove UPM packages or feature sets
- Install a feature set from the Unity registry
- Install a UPM package from a registry
- Install a UPM package from the Asset Store
- Install a UPM package from a local folder
- Install a UPM package from a local tarball file
- Install a UPM package from a Git URL
- Install a UPM package by name
- Remove a UPM package from a project
- Switch to another version of a UPM package
- Add and remove asset packages
- Disable a built-in package
- Perform an action on multiple packages
- Finding package documentation
- Inspecting packages
- Scripting API for packages
- Scoped registries
- Resolution and conflict
- Project manifest
- Troubleshooting
- Creating custom packages
- Feature sets
- Released packages
- Install Unity
- Licenses and activation
- Upgrade Unity
- Create with Unity
- 2D or 3D projects
- Unity's interface
- The Project window
- The Scene view
- The Game view
- Device Simulator
- The Hierarchy window
- The Inspector window
- Editing properties
- The Toolbar
- The status bar
- The Background Tasks window
- Console Window
- Additional windows
- Undo
- Search in the Editor
- Customizing your workspace
- Unity shortcuts
- Quickstart guides
- Advanced best practice guides
- Create Gameplay
- Editor Features
- Analysis
- Memory in Unity
- Profiler overview
- Profiling your application
- Common Profiler markers
- The Profiler window
- Asset Loading Profiler module
- Audio Profiler module
- CPU Usage Profiler module
- File Access Profiler module
- Global Illumination Profiler module
- GPU Usage Profiler module
- Highlights Profiler Module
- Memory Profiler module
- Physics Profiler module
- Physics 2D Profiler module
- Rendering Profiler module
- UI and UI Details Profiler
- Video Profiler module
- Virtual Texturing Profiler module
- Customizing the Profiler
- Low-level native plug-in Profiler API
- Profiling tools
- Log files
- Understanding optimization in Unity
- Asset loading metrics
- Asset workflow
- Input
- 2D game development
- Introduction to 2D
- 2D game development quickstart guide
- 2D Sorting
- Work with sprites
- Tilemaps
- Essential tilemap steps and tools
- Active brush
- Create Tilemaps
- Create Tiles
- Create a Tile Palette
- Tile Palette editor tools
- Using the Select tool
- Move selected tiles with the Move tool
- Paint tiles with the Paint tool
- Use the Box Fill tool to fill an area with duplicated tiles
- Select tiles on the tilemap or Tile Palette with the Pick tool
- Remove tiles from the tilemap with the Eraser tool
- Fill an empty area with tiles with the Flood Fill tool
- Brush Picks
- Tilemap Collider 2D component reference
- Hexagonal Tilemaps
- Isometric Tilemaps
- Scriptable Tiles
- Scriptable Brushes
- Tile Palette visual elements
- Tilemap component reference
- Grid component reference
- Tilemap Renderer component reference
- Tile asset reference
- Tile Palette preferences reference
- Tile Palette editor reference
- Essential tilemap steps and tools
- Physics 2D Reference
- Graphics
- Render pipelines
- Render pipelines introduction
- Render pipeline feature comparison
- How to get, set, and configure the active render pipeline
- Choosing and configuring a render pipeline and lighting solution
- Using the Built-in Render Pipeline
- Using the Universal Render Pipeline
- Using the High Definition Render Pipeline
- Scriptable Render Pipeline fundamentals
- Creating a custom render pipeline
- Cameras
- Lighting
- Introduction to lighting
- Light sources
- Shadows
- The Lighting window
- Lighting Settings Asset
- The Light Explorer window
- Lightmapping
- Realtime Global Illumination using Enlighten
- Light Probes
- Reflection Probes
- Precomputed lighting data
- Debug Draw Modes for lighting
- Models
- Meshes
- Textures
- Importing Textures
- Texture Import Settings
- Default Import Settings reference
- Normal map Import Settings reference
- Editor GUI and Legacy GUI Import Settings reference
- Sprite (2D and UI) Import Settings reference
- Cursor Import Settings reference
- Cookie Import Settings reference
- Lightmap Import Settings reference
- Directional Lightmap Import Settings reference
- Shadowmask Import Settings reference
- Single Channel Import Settings reference
- Texture Import Settings
- Texture formats
- Mipmaps
- Render Texture
- Custom Render Textures
- Movie Textures
- 3D textures
- Texture arrays
- Cubemaps
- Cubemap arrays
- Streaming Virtual Texturing
- Streaming Virtual Texturing requirements and compatibility
- How Streaming Virtual Texturing works
- Enabling Streaming Virtual Texturing in your project
- Using Streaming Virtual Texturing in Shader Graph
- Cache Management for Virtual Texturing
- Marking textures as "Virtual Texturing Only"
- Virtual Texturing error material
- Sparse Textures
- Loading texture and mesh data
- Importing Textures
- Shaders
- Shaders core concepts
- Built-in shaders
- Standard Shader
- Standard Particle Shaders
- Autodesk Interactive shader
- Legacy Shaders
- Using Shader Graph
- Writing shaders
- Writing shaders overview
- ShaderLab
- ShaderLab: defining a Shader object
- ShaderLab: defining a SubShader
- ShaderLab: defining a Pass
- ShaderLab: adding shader programs
- ShaderLab: specifying package requirements
- ShaderLab: commands
- ShaderLab: grouping commands with the Category block
- ShaderLab command: AlphaToMask
- ShaderLab command: Blend
- ShaderLab command: BlendOp
- ShaderLab command: ColorMask
- ShaderLab command: Conservative
- ShaderLab command: Cull
- ShaderLab command: Offset
- ShaderLab command: Stencil
- ShaderLab command: UsePass
- ShaderLab command: GrabPass
- ShaderLab command: ZClip
- ShaderLab command: ZTest
- ShaderLab command: ZWrite
- ShaderLab legacy functionality
- HLSL in Unity
- GLSL in Unity
- Example shaders
- Writing Surface Shaders
- Writing shaders for different graphics APIs
- Understanding shader performance
- Materials
- Visual effects
- Post-processing and full-screen effects
- Particle systems
- Choosing your particle system solution
- Built-in Particle System
- Using the Built-in Particle System
- Particle System vertex streams and Standard Shader support
- Particle System GPU Instancing
- Particle System C# Job System integration
- Components and Modules
- Particle System
- Particle System modules
- Main module
- Emission module
- Shape module
- Velocity over Lifetime module
- Noise module
- Limit Velocity over Lifetime module
- Inherit Velocity module
- Lifetime by Emitter Speed module
- Force over Lifetime module
- Color over Lifetime module
- Color by Speed module
- Size over Lifetime module
- Size by Speed module
- Rotation over Lifetime module
- Rotation by Speed module
- External Forces module
- Collision module
- Triggers module
- Sub Emitters module
- Texture Sheet Animation module
- Lights module
- Trails module
- Custom Data module
- Renderer module
- Particle System Force Field
- Visual Effect Graph
- Decals and projectors
- Lens flares and halos
- Lines, trails, and billboards
- Sky
- Color
- Graphics API support
- Graphics performance and profiling
- Render pipelines
- World building
- Physics
- Built-in 3D Physics
- Character control
- Rigidbody physics
- Collision
- Joints
- Articulations
- Ragdoll physics
- Cloth
- Multi-scene physics
- Built-in 3D Physics
- Scripting
- Setting Up Your Scripting Environment
- Scripting concepts
- Important Classes
- Unity architecture
- Plug-ins
- Job system
- Unity Properties
- UnityWebRequest
- Multiplayer
- Audio
- Audio overview
- Audio files
- Tracker Modules
- Audio Mixer
- Native audio plug-in SDK
- Audio playlist randomization
- Audio Profiler
- Ambisonic Audio
- Audio Reference
- Audio Clip
- Audio Listener
- Audio Source
- Audio Mixer
- Audio Filters
- Audio Effects
- Audio Low Pass Effect
- Audio High Pass Effect
- Audio Echo Effect
- Audio Flange Effect
- Audio Distortion Effect
- Audio Normalize Effect
- Audio Parametric Equalizer Effect
- Audio Pitch Shifter Effect
- Audio Chorus Effect
- Audio Compressor Effect
- Audio SFX Reverb Effect
- Audio Low Pass Simple Effect
- Audio High Pass Simple Effect
- Reverb Zones
- Microphone
- Audio Settings
- Video overview
- Animation
- Animation system overview
- Rotation in animations
- Animation Clips
- Animator Controllers
- Retargeting of Humanoid animations
- Performance and optimization
- Animation Reference
- Animation FAQ
- Playables API
- A Glossary of animation terms
- Legacy Animation system
- User interface (UI)
- Comparison of UI systems in Unity
- UI Toolkit
- Get started with UI Toolkit
- UI Builder
- Structure UI
- The visual tree
- Structure UI with UXML
- Structure UI with C# scripts
- Custom controls
- Best practices for managing elements
- Encapsulate UXML documents with logic
- UXML elements reference
- UXML element BindableElement
- UXML element VisualElement
- UXML element BoundsField
- UXML element BoundsIntField
- UXML element Box
- UXML element Button
- UXML element ColorField
- UXML element CurveField
- UXML element DoubleField
- UXML element DropdownField
- UXML element EnumField
- UXML element EnumFlagsField
- UXML element FloatField
- UXML element Foldout
- UXML element GradientField
- UXML element GroupBox
- UXML element Hash128Field
- UXML element HelpBox
- UXML element IMGUIContainer
- UXML element Image
- UXML element InspectorElement
- UXML element IntegerField
- UXML element Label
- UXML element LayerField
- UXML element LayerMaskField
- UXML element LongField
- UXML element ListView
- UXML element MaskField
- UXML element MinMaxSlider
- UXML element MultiColumnListView
- UXML element MultiColumnTreeView
- UXML element ObjectField
- UXML element PopupWindow
- UXML element ProgressBar
- UXML element PropertyField
- UXML element RadioButton
- UXML element RadioButtonGroup
- UXML element RectField
- UXML element RectIntField
- UXML element RepeatButton
- UXML element RenderingLayerMaskField
- UXML element ScrollView
- UXML element Scroller
- UXML element Slider
- UXML element SliderInt
- UXML element Tab
- UXML element TabView
- UXML element TagField
- UXML element TextElement
- UXML element TextField
- UXML element TemplateContainer
- UXML element Toggle
- UXML element ToggleButtonGroup
- UXML element Toolbar
- UXML element ToolbarBreadcrumbs
- UXML element ToolbarButton
- UXML element ToolbarMenu
- UXML element ToolbarPopupSearchField
- UXML element ToolbarSearchField
- UXML element ToolbarSpacer
- UXML element ToolbarToggle
- UXML element TreeView
- UXML element TwoPaneSplitView
- UXML element UnsignedLongField
- UXML element UnsignedIntegerField
- UXML element Vector2Field
- UXML element Vector2IntField
- UXML element Vector3Field
- UXML element Vector3IntField
- UXML element Vector4Field
- Structure UI examples
- Create list and tree views
- Create a complex list view
- Create a list view runtime UI
- Wrap content inside a scroll view
- Create a tabbed menu
- Create a pop-up window
- Use Toggle to create a conditional UI
- Create a custom control with two attributes
- Create a slide toggle custom control
- Create a bindable custom control
- Create a custom style for a custom control
- Create a drag-and-drop list and tree views between windows
- Create an aspect ratio custom control
- Style UI
- UI Toolkit Debugger
- Control behavior with events
- UI Renderer
- Data binding
- Comparison of the binding systems
- Runtime data binding
- SerializedObject data binding
- Introduction to SerializedObject data binding
- Bindable elements reference
- Bindable data types and fields
- Binding system implementation details
- Binding examples
- Bind with binding path in C# script
- Bind without the binding path
- Bind with UXML and C# script
- Create a binding with the Inspector
- Bind to nested properties
- Bind to a UXML template
- Receive callbacks when a bound property changes
- Receive callbacks when any bound properties change
- Bind to a list with ListView
- Bind to a list without ListView
- Bind a custom control
- Bind a custom control to custom data type
- Support for Editor UI
- Support for runtime UI
- Work with text
- Examples
- Migration guides
- Unity UI
- Immediate Mode GUI (IMGUI)
- Unity Services
- Setting up your project for Unity services
- Unity Organizations
- Unity Ads
- Unity Analytics
- Unity Cloud Content Delivery
- Unity Build Automation (formerly Cloud Build)
- Unity IAP
- Setting up Unity IAP
- Cross Platform Guide
- Codeless IAP
- Defining products
- Subscription Product support
- Initialization
- Browsing Product Metadata
- Initiating Purchases
- Processing Purchases
- Handling purchase failures
- Restoring Transactions
- Purchase Receipts
- Receipt validation
- Store Extensions
- Cross-store installation issues with Android in-app purchase stores
- Store Guides
- Implementing a Store
- Unity Cloud Diagnostics
- Unity Integrations
- Multiplayer services
- Unity Distribution Portal
- Unity Accelerator
- XR
- Unity's Asset Store
- Asset Store packages
- Publishing to the Asset Store
- Creating your Publisher Account
- Creating a new package draft
- Deleting a package draft
- Uploading assets to your package
- Filling in the package details
- Submitting your package for approval
- Viewing the status of your Asset Store submissions
- Collecting revenue
- Providing support to your customers
- Adding tags to published packages
- Connecting your account to Google Analytics
- Promoting your Assets
- Refunding your customers
- Upgrading packages
- Deprecating your Assets
- Issuing vouchers
- Managing your publishing team
- Asset Store Publisher portal
- Verified Solutions
- Platform development
- Using Unity as a Library in other applications
- Deep linking
- Xcode frame debugger Unity integration
- Android
- Introducing Android
- Getting started with Android
- Developing for Android
- Android mobile scripting
- Input for Android devices
- Android application size restrictions
- Graphics for Android
- Testing and debugging
- Optimization for Android
- Create and use plug-ins in Android
- Integrating Unity into Android applications
- Android application entry points
- Deep linking on Android
- Device features and permissions
- Handle Android crashes
- Quit a Unity Android application
- Building and delivering for Android
- ChromeOS
- Dedicated Server
- iOS
- Introducing iOS
- Getting started with iOS
- Developing for iOS
- iOS Scripting
- Input for iOS devices
- Unity's Device Simulator for iOS
- Unity Remote
- Managed stack traces on iOS
- Optimize performance for iOS
- Native plug-ins for iOS
- Integrating Unity into native iOS applications
- Deep linking on iOS
- iOS authorizations in Unity
- Preparing your application for In-App Purchases (IAP)
- Social API
- Troubleshooting on iOS devices
- Reporting crash bugs on iOS
- Building and delivering for iOS
- Linux
- macOS
- tvOS
- Web
- Web introduction
- Web development
- Web Player settings
- Interaction with browser scripting
- Code examples: Call JavaScript and C/C++/C# functions in Unity
- Set up your JavaScript plug-in
- Call JavaScript functions from Unity C# scripts
- Call Unity C# script functions from JavaScript
- Call C/C++/C# functions from Unity C# scripts
- Compile a static library as a Unity plug-in
- Create callbacks between Unity C#, JavaScript, and C/C++/C# code
- Replace deprecated browser interaction code
- Web native plug-ins for Emscripten
- Memory in Unity Web
- Cache behavior in Web
- Web graphics
- Audio in Web
- Video playback in Web
- Texture compression in Web
- Embedded resources in Web
- Input in Web
- Configure a Web Canvas size
- Web browser access to device features
- Web networking
- Cursor locking and full-screen mode in Web
- Web performance considerations
- Debug and troubleshoot Web builds
- Build and distribute a Web application
- Windows
- Universal Windows Platform
- Introduction to Universal Windows Platform
- Get started with Universal Windows Platform
- Develop for Universal Windows Platform
- Build and deliver for Universal Windows Platform
- Unity Search
- Glossary
- Create with Unity
- Analysis
- Profiler overview
- The Profiler window
- CPU Usage Profiler module
CPU Usage Profiler module
The CPU Usage ProfilerA window that helps you to optimize your game. It shows how much time is spent in the various areas of your game. For example, it can report the percentage of time spent rendering, animating, or in your game logic. More info
See in Glossary module contains a chart that displays where time is spent in your application. It provides an overview of all the significant areas where your application spends time, such as on rendering, its scriptsA piece of code that allows you to create your own Components, trigger game events, modify Component properties over time and respond to user input in any way you like. More info
See in Glossary, and animation. This section of the documentation covers:
- Chart categories
- Module details pane
- Timeline view
- Hierarchy views
- Allocation call stacks
- Common markers
Chart categories
The CPU Usage Profiler module’s chart tracks the time spent on the application’s main thread. The timings are divided into nine categories. To change the order of the categories in the chart, you can drag and drop them in the chart’s legend. You can also click a category’s colored legend to toggle its display.
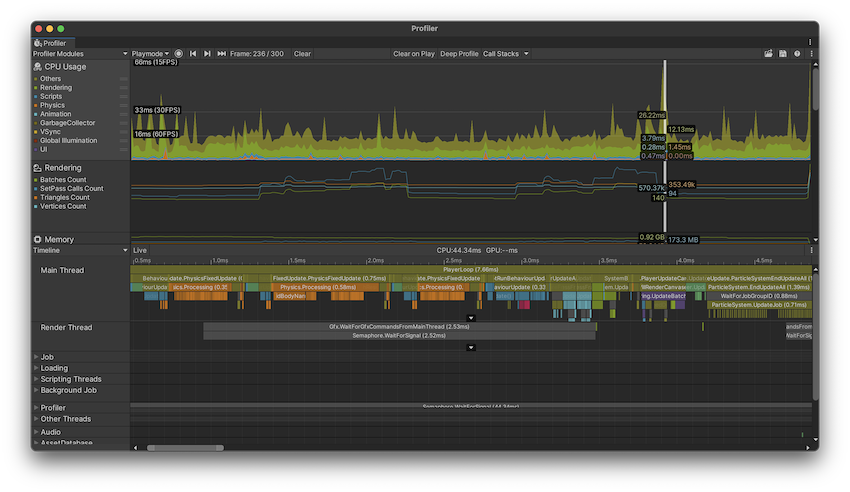
| Category | Description |
|---|---|
| Rendering | How much time your application spends on rendering graphics. |
| Scripts | How much time your application spends on running scripts. |
| Physics | How much time your application spends on the physics engineA system that simulates aspects of physical systems so that objects can accelerate correctly and be affected by collisions, gravity and other forces. More info See in Glossary. |
| Animation | How much time your application spends on animating Skinned MeshThe main graphics primitive of Unity. Meshes make up a large part of your 3D worlds. Unity supports triangulated or Quadrangulated polygon meshes. Nurbs, Nurms, Subdiv surfaces must be converted to polygons. More info See in Glossary Renderers, GameObjectsThe fundamental object in Unity scenes, which can represent characters, props, scenery, cameras, waypoints, and more. A GameObject’s functionality is defined by the Components attached to it. More info See in Glossary and other components in your application. This also includes the time spent on calculations for systems the Animation and Animator componentsA component on a model that animates that model using the Animation system. The component has a reference to an Animator Controller asset that controls the animation. More info See in Glossary use. |
| GarbageCollector | How much time your application spends on running the Garbage Collector. |
| VSyncVertical synchronization (VSync) is a display setting that caps a game’s frame rate to match the refresh rate of a monitor, to prevent image tearing. See in Glossary |
How much time your application spends per frame waiting for the targetFrameRate or the next VBlankVertical blanking interval (VBlank) is the time between the end of the final visible line of a frame and the beginning of the first visible line of the next frame. This is the refresh interval as defined by a screen’s refresh rate. See in Glossary to sync with. This is according to the QualitySettings.vSyncCount value, the target frame rate, or the VSync setting that is the default or enforced maximum of the platform your application is running on. For more information about VSync, refer to the section in this documentation on Rendering and VSync samples. |
| Global IlluminationA group of techniques that model both direct and indirect lighting to provide realistic lighting results. See in Glossary |
How much time your application spends on lighting. |
| UI(User Interface) Allows a user to interact with your application. Unity currently supports three UI systems. More info See in Glossary |
How much time your application spends on displaying its UI. |
| Others | How much time your application spends on code that does not fall into any of the other categories. This includes areas like the entire EditorLoop, or the Profiling overhead when you profile Play Mode in the Editor. |
Module details pane
When you select the CPU Usage module, the details pane below it displays a breakdown of where the application spent time in the selected frame. You can display the timing data as either a timeline or a hierarchical table. To change the display, use the top-left dropdown in the details pane (set to Timeline by default). The three views available are:
| View | Function |
|---|---|
| Timeline | Displays a breakdown of the timings for a particular frame, alongside a time axis of the frame’s length. This is the only view mode that you can use to see timings on all threads at once and at the times within the frame at which they happened, so that you can correlate timings across threads (for example, Job System worker threads starting up after a system on the main thread schedules them). |
| Hierarchy | Groups the timing data by its internal hierarchical structure. This option displays the elements that your application called in a descending list format, ordered by the time spent by default. You can also order the information by the amount of scripting memory allocated (GC Alloc), or the number of calls. To change the column that orders the table, click the table column’s header. |
| Raw Hierarchy | Displays the timing data in a hierarchical structure that is similar to the call stacks where the timing occurred. Unity lists each call stack separately in this mode instead of merging them, as it does in Hierarchy view. |
| Inverted Hierarchy | Groups samples by profiler marker and displays them with inverted sample stacks. The first level of the hierarchy shows an item for each profiler marker. Expand an item in the tree to show the markers that contain this one in their sample stack. This option helps to reveal larger performance issues caused by lots of instances of small performance impacts. These kinds of issues can be harder to spot in the Timeline or non-inverted hierarchy views. As with the other hierarchy views, click on column headers to order items. |
Live setting
The Live setting, which is available in each of the views, displays the information about the current or selected frame in the module details pane when you start recording new data in Playmode or the Editor. To enable this, click the Live button next to the module details dropdown. By default, this setting is disabled, and the module details pane is blank when you record data. Note: This setting increases the overhead of the EditorLoop when the Profiler window is repainted.
Show Full Scripting Method Names setting
Additionally, in each view, you can select the More Items menu (⋮) and enable Show Full Scripting Method Names, which then displays the fully qualified names for all scripting methods (Assembly::Class::MethodName).
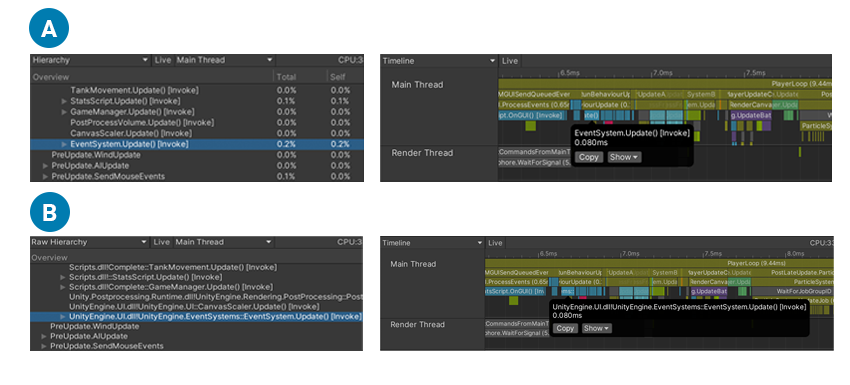
B: Scripting methods in the Hierarchy view and Timeline view with Show Full Scripting Method Names enabled
Timeline view
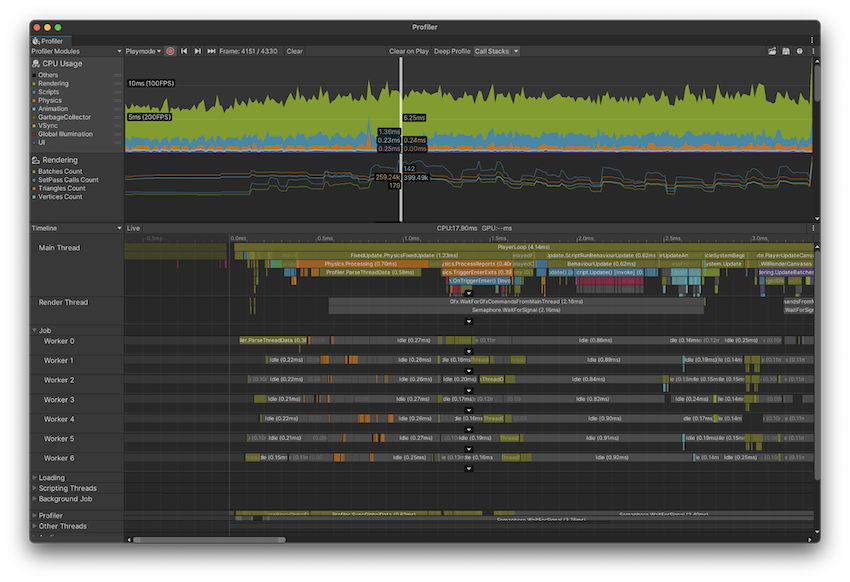
The Timeline view is the default view for the CPU Usage Profiler module. It contains an overview of where time is spent in your application and how the timings relate to each other.
The Timeline view displays profiling data from all threads in their own subsections and along the same time axis, unlike the Hierarchy views. The Hierarchy views only display profiling data one thread at a time, defaulting to the main thread. Also, these views only show a sample’s duration, whereas the Timeline view shows at which times each sample occurred.
You can use the Timeline view to see how activities on the different threads correlate to each other in their parallel execution. You can see how much or little you are using the different threads, such as the Job System’s worker threads, how work on the threads are queued up, and if any thread is idling (Idle sample) or waiting for another thread or a Job to finish (Wait for x sample).
Navigating and selecting items
To zoom in on areas of the time axis, use the scroll wheel on your mouse, or press and hold the Alt key while you drag with the right mouse button pressed down. You can also use the ends of the horizontal scrollbar to zoom in. Press the A key on your keyboard to reset the zoom so that the entire frame time is visible.
Whenever you see a white arrow on the bottom of a thread, you can click it to unfold the thread to show all lines, or click again to show only the top ones. You can also drag the line that separates the threads to readjust how many lines you can see. Double-clicking the line sets the height of the thread’s section to the maximum depth of the call stack. To pan the view, press the middle mouse button, or hold the Alt key (Command key on macOS) and press the left mouse button.
To collapse and expand groups of threads, click on the foldout arrows next to the thread names on the far left of the view.
To see an item’s contribution to the CPU chart, select it in the lower pane. The Profiler highlights its contribution, and dims the rest of the chart. To deselect the item, click elsewhere in the view. Press the F key to focus the current sample you selected, or to show the default zoom level if you’ve selected nothing.
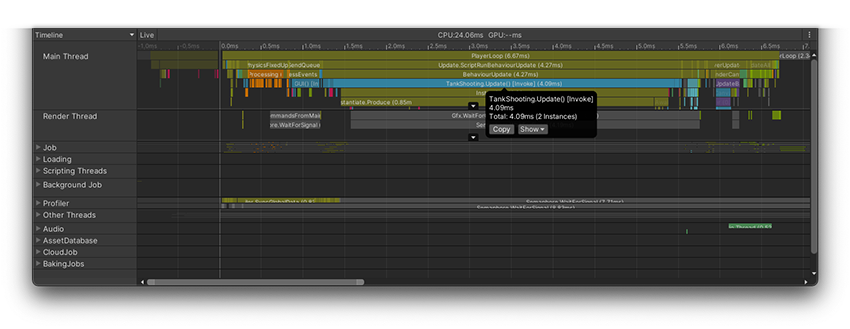
In the image above, the tooltip on the selected sample provides further details, such as the number of instances and the total time of this sample across all threads. You can select the text within the tooltip and copy it as well as use the buttons to interact with the sample further:
| Operation | Description |
|---|---|
| Copy | Copy the call stack and the entire content of the tooltip to your clipboard. |
| Show | Select this dropdown to choose from the following options: |
| Hierarchy | Switch to this sample in Hierarchy view |
| Raw Hierarchy | Switch to this sample in Raw Hierarchy view |
| Inverted Hierarchy | Switch to this sample in Inverted Hierarchy view |
| Full Details for Call Stacks | Unity records call stacks as a list of method pointer addresses, which it uses to display the method name, file path, and line number of the stack. Whenever only the pointer address is present, Unity ignores it to conserve screen space for the actionable items that have further information available. Enable this property to see the full list of method pointer addresses of the call stack. |
| Selected Sample Stack | View the details of the sample stack. Unity opens this information in a separate window. You can then copy the sample stack information to your clipboard. The sample stack differs from a method’s call stack because Unity does not tie every sample to a specific method, nor does it record every call as a sample. If you select a sample in a different frame and there isn’t a sample with the same sample stack in the displayed frame, this window shows both the sample stack of the original selection, as well as the approximate selection for this frame. |
GC.Alloc samples appear colored in red-magenta, and show you the size of the allocation.
To show managed call stacks in the tooltip, navigate to the Profiler window’s toolbarA row of buttons and basic controls at the top of the Unity Editor that allows you to interact with the Editor in various ways (e.g. scaling, translation). More info
See in Glossary, and select the Call Stacks button. You must enable this property before you profile a frame to display the call stack for a frame. For more information, refer to the section on call stacks.
Flow Events
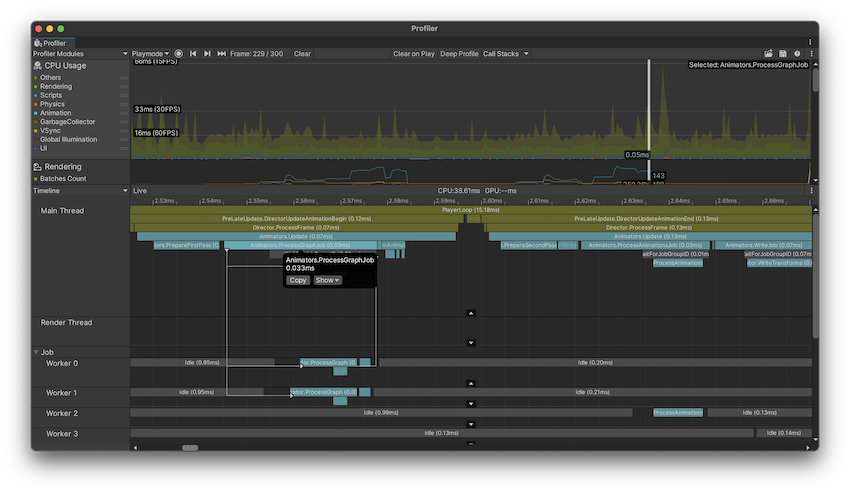
To help you visualize how Unity schedules jobs across threads, you can use the Flow Events setting. This setting displays the relationship between systems, jobs and threads. To enable this setting, select the More menu (⋮) in the top right of the Timeline view pane, and then select Show Flow Events.
When you enable this setting, the Profiler adds white event markers to the Profiler samplesA set of data associated with a Profiler marker, that the Profiler has recorded and collected.
See in Glossary that schedule jobs, or wait on scheduled jobs to complete. It also darkens unrelated samples so that you can more easily visualize the sample you select.
There are three types of arrows the Profiler adds to the samples:
- Down arrow: Indicates the beginning of a flow, and that this sample scheduled some work.
- Right arrow: Indicates the next item in a flow, and that a different sample scheduled this.
- Up arrow: Indicates the end of a flow, and that the work ended or synchronized on this sample.
When you select a sample, the Profiler connects the relevant flow event markers together with lines. A thicker line highlights the particular flow line you select. For example, if a begin sample points to two other next samples, when you click one of the next samples, the Profiler draws a thicker line to it.
This view is useful to discover the flow of execution of your code, what work was being waited on to complete, and helps you uncover the dependencies of your code in a visual way.
Hierarchy views
When you switch to the Hierarchy, Raw Hierarchy or Inverted Hierarchy view, your selection carries over, as long as the sample is on the main thread. If you cannot immediately find your selection, press the F key to focus it.
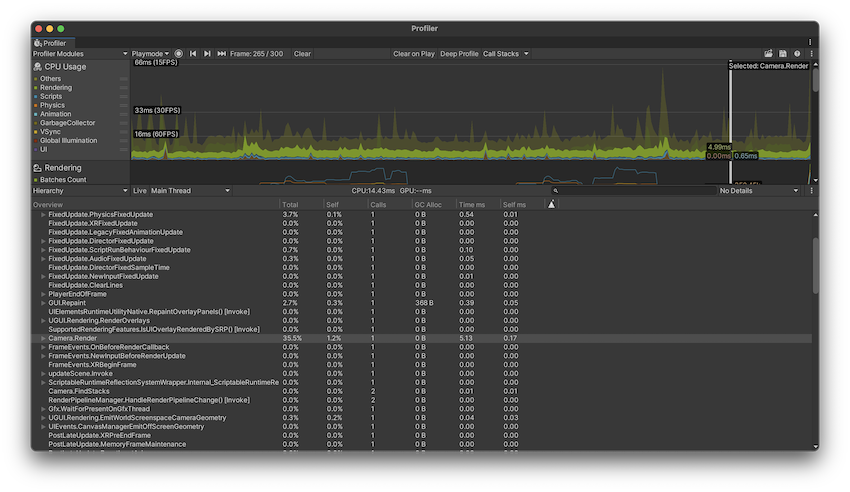
The Hierarchy view lists all samples you have profiled and groups them together by their shared call stack and the hierarchy of ProfilerMarkers. The Raw Hierarchy view does not group samples together, which makes it ideal for looking into samples on a granular level.
The Inverted Hierarchy view groups samples by profiler markerPlaced in code to describe a CPU or GPU event that is then displayed in the Unity Profiler window. Added to Unity code by default, or you can use ProfilerMarker API to add your own custom markers. More info
See in Glossary and displays them with inverted sample stacks. The first level of the hierarchy shows an item for each profiler marker. Expand an item in the tree to show the markers that contain this one in their sample stack. This option helps to reveal larger performance issues caused by lots of instances of small performance impacts. These kinds of issues can be harder to spot in the Timeline or non-inverted hierarchy views. As with the other hierarchy views, click on column headers to order items.
In all of the hierarchy views, you can use the Thread dropdown to select a specific thread, like the Main Thread or Render Thread to inspect in these views.
By default, all EditorOnly samples are collapsed in these views. EditorOnly samples are samples in the Player Loop that only happen because of Editor-only safety checks. When the samples are collapsed, their GC.Alloc value does not contribute to the GC.Alloc value of their enclosing sample. To display these samples, select the More Items menu (⋮) in the top right of the details pane, and then disable the Collapse EditorOnly Samples setting. For more information, refer to Editor only samples.
The hierarchy views display the following detailed information for each item in the Hierarchy, next to each row:
| Property | Function |
|---|---|
| Total | The total amount of time Unity spent in a particular sample, as a percentage of the total frame time. |
| Self | The total amount of time Unity spent in a particular sample as a percentage of the total frame time, excluding the time from sub-samples. For example, in the screenshot, 16.7% of time is spent in the Camera.Render function. This is because it calls a lot of drawing and culling functions. However, when you exclude the samples for the functions it calls, only 0.2% of time is spent on the Camera.Render function itself. |
| Calls | The number of calls made to this sample in this frame. In the Raw Hierarchy view the values in this column are always 1 because the Profiler does not merge the hierarchy of samples. |
| GC Alloc | How much scripting heap memory Unity has allocated in the current frame. The garbage collector manages the scripting heap memory. Whenever Unity calls GC.Collect() or there is a scripting heap allocation that does not fit within the heap’s current size, the garbage collector triggers. It marks all allocations that have no more references to them and collects them. This process appears as GC.Collect samples in the Profiler. Unity runs the garbage collector more frequently as your application allocates more on the heap. As the managed heap grows, it takes Unity longer to mark and collect the memory. As such, you should keep the GC Alloc value at zero while your application runs, to prevent the garbage collector from affecting your application’s frame rate, and to keep the overall heap size small. For more details about the managed heap refer to the documentation on Understanding Automatic Memory Management. |
| Time ms | The total amount of time Unity spent in a particular sample, in milliseconds. If your application uses the Job System or multithreaded rendering, this information might be misleading, because it only contains the time Unity spent on the currently selected thread. To change the thread, select the Thread dropdown at the top of the Hierarchy pane. |
| Self ms | The total amount of time Unity spent in a particular sample, in milliseconds, excluding the time Unity spends calling sub-functions. |
| Warning | Indicated by a warning icon, this displays how many times the application has triggered a warning during the current frame. For more information, refer to Performance warnings. |
In the Inverted Hierarchy view, each child item displays information relative to its parent item. Each child item in the tree represents part of an inverted sample stack and its data shows how much time or heap memory is contributed via this sample stack to the aggregated parent item. The following scenario illustrates this process.
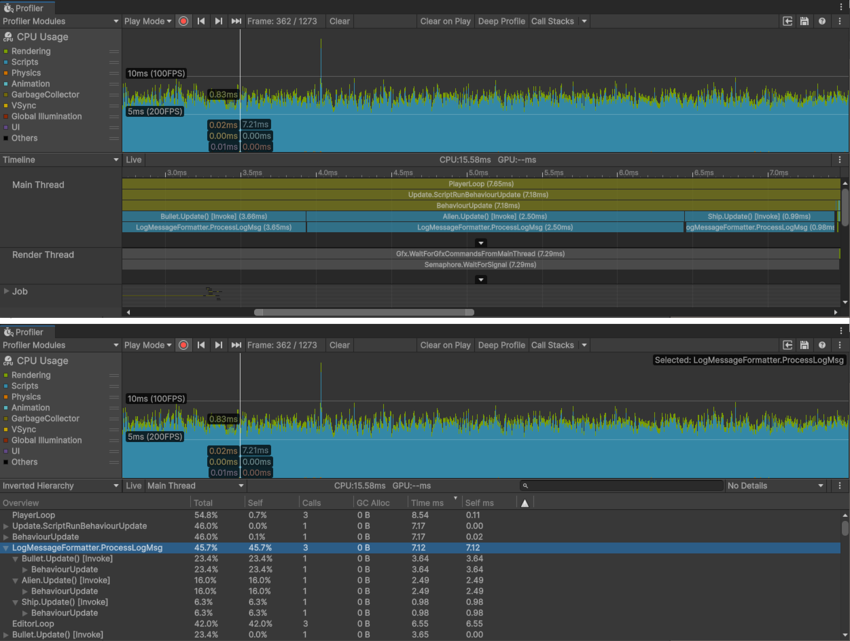
Bullet.Update(), Alien.Update() and Ship.Update() all call a method named LogMessageFormatter.ProcessLogMsg, which executes in a different amount of time on each occasion. In the Inverted Hierarchy view, the LogMessageFormatter.ProcessLogMsg samples are combined into a single root item which shows the total time spent inside all instances of the sample during the frame. The tree expands to show each of the three sample stacks that led to this sample and the time that each stack contributes to the overall time.
To keep this example short, LogMessageFormatter.ProcessLogMsg is only called three times and has a relatively long execution time. However, if this method executed much faster and was called many times in a frame, its total execution time could still contribute significantly to the overall frame time. In such situations, the Inverted Hierarchy view makes the relevant markers much easier to identify.
Related data
To get more information about where your application calls and uses the profiled functions, select the Details dropdown at the top right hand corner of the module details pane and choose either Related Data or Calls view.
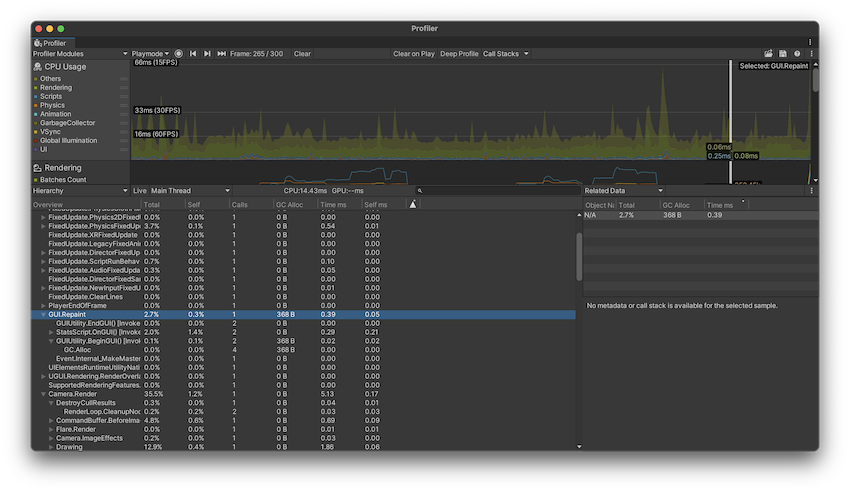
The Related Data view displays a list of UnityEngine.Objects that use a Begin() overload and are associated with the Profiler sample. Some samples that Unity reports have these associations built in, such as CameraA component which creates an image of a particular viewpoint in your scene. The output is either drawn to the screen or captured as a texture. More info
See in Glossary.Render samples that are linked to the Camera GameObject that does the rendering. Unity reports these objects via their instance ID and resolves them to a name in the Profiler window, if you profile in the Editor.
When you click on one of these objects, Unity tries to find the object via the SceneA Scene contains the environments and menus of your game. Think of each unique Scene file as a unique level. In each Scene, you place your environments, obstacles, and decorations, essentially designing and building your game in pieces. More info
See in Glossary hierarchy and ping it. Because the association uses the instance ID, pinging only works when you profile your application in the Editor, and for as long as the object still exists.
For GC.Alloc samples, this view displays a list of N/A items, one for each allocation that happened at this hierarchy level, with the size of the allocation listed in the GC.Alloc column. If you profile your application with the Call StacksA list of methods that were called at run time, organized as a last-in-first-out stack.
See in Glossary setting enabled, when you select a GC.Alloc sample in this view, the Profiler window displays the call stack for the allocated scripting object you select, even if you did not enable the Deep Profiling setting. For more information, refer to the Allocation call stacks section of this documentation.
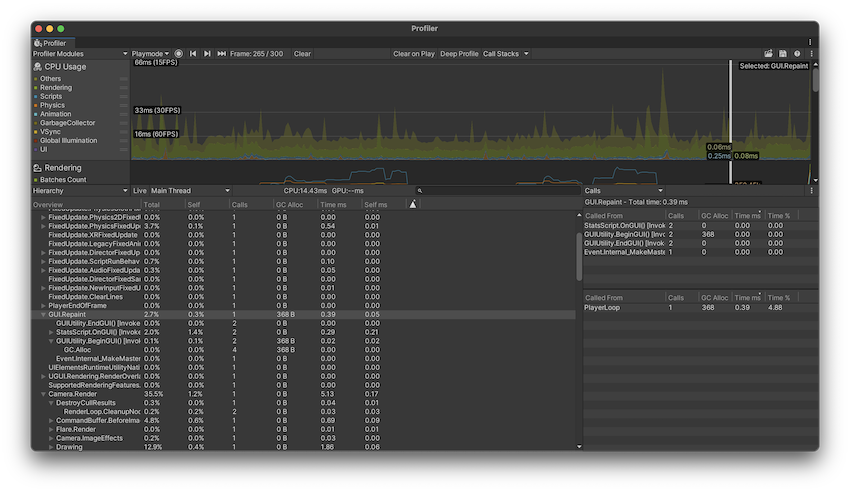
The Calls view displays where the selected sample is being called from as well as what other functions it calls to.
Call stacks
ProfilerMarkers emit a set of samples which the Profiler uses to display and organize profiling information into different chronological and hierarchical views. Any sample displayed in the Profiler window is therefore part of a sample stack.
A sample stack differs from a method’s call stack because Unity does not tie every sample to a specific method, nor does it record every call as a sample. Deep Profiling adds a ProfilerMarker to every function call, but it does not add any for native code, plus recording all of these samples comes with a potentially high overhead.
You can enable the full call stacks for samples that GC.Alloc, UnsafeUtility.Malloc, JobHandle.Complete emit. This is useful if you want to track down where these samples happened, without enabling Deep Profiling and encountering its high overhead. For more information about these markers, refer to the documentation on Common Profiler Markers.
To enable full call stacks for these samples, navigate to the toolbar of the Profiler window and enable the Call Stacks button. By default, this enables the call stacks for GC.Alloc samples. To enable other call stacks, select the dropdown arrow and enable any of the other markers you would like to see the call stacks for.
You can use this functionality whether you profile in the Editor or on a running player. This only takes effect for the frames you profile after you turn this option on.
For example, every scripting heap allocation shows up as a GC.Alloc sample in both the Hierarchy view and Timeline view. In the Timeline view, it is colored bright magenta. To see a call stack, select the CPU Profiler module and then select a GC.Alloc sample in Timeline view. The call stack appears in the selection highlight.
To copy the call stack, select the Copy button in the tooltip. You can also open the relevant code file from this view if the file path is highlighted as a blue link. Click on the link and the file opens in your default IDE. Note: The call stack information does not contain the exact line number within that method but just the line at the beginning of that method.
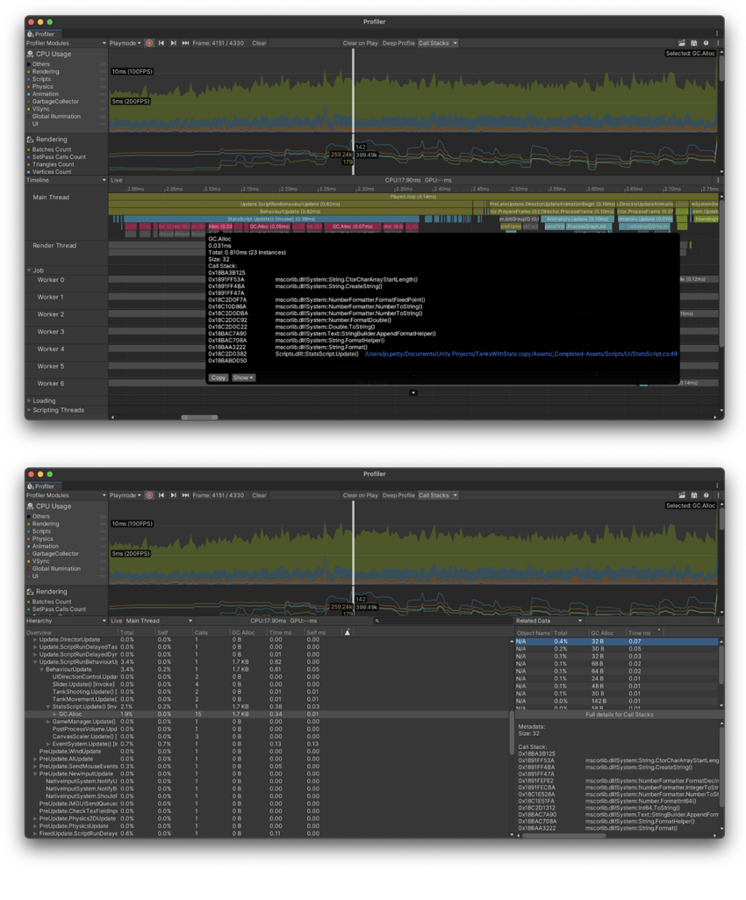
You can also use the Show dropdown to see the GC.Alloc’s sample stack, its full details, or switch to view it in the Hierarchy or Raw Hierarchy view.
To see the full call stack details, while in the Hierarchy or Raw Hierarchy view, set the Details view to Related Data. This view lists the metadata associated with this sample, which might include a UnityEngine.Object that it was associated with. For any metadata entry that is not associated with a UnityEngine.Object, the name shows up as N/A in this panel. When you select an N/A entry, the Profiler displays the meta data, including the call stack in the bottom half of the details view.
For more information about managed allocations, refer to the documentation on Understanding Automatic Memory Management.
Common markers
Unity’s code is instrumented with a large number of Profiler markers that give you insight into what is taking up time in your application. For a full list of the most common markers you might see in your profiling data, refer to the documentation on Common Profiler markers.