Unity Manual
- Unity User Manual 2020.3 (LTS)
- New in Unity 2020 LTS
- Packages
- Verified packages
- 2D Animation
- 2D Pixel Perfect
- 2D PSD Importer
- 2D SpriteShape
- Adaptive Performance
- Adaptive Performance Samsung Android
- Addressables
- Ads Mediation
- Advertisement Legacy
- Alembic
- Analytics
- Android Logcat
- Animation Rigging
- AR Foundation
- ARCore XR Plugin
- ARKit Face Tracking
- ARKit XR Plugin
- Authentication
- Burst
- CCD Management
- Cinemachine
- Cloud Code
- Cloud Save
- Code Coverage
- Collections
- Core RP Library
- Economy
- Editor Coroutines
- FBX Exporter
- High Definition RP
- In App Purchasing
- Input System
- iOS 14 Advertising Support
- JetBrains Rider Editor
- Lobby
- Magic Leap XR Plugin
- Matchmaker
- Mathematics
- ML Agents
- Mobile Notifications
- Multiplayer HLAPI
- Netcode for GameObjects
- Oculus XR Plugin
- OpenXR Plugin
- Polybrush
- Post Processing
- ProBuilder
- Profile Analyzer
- Quick Search
- Recorder
- Relay
- Remote Config
- Scriptable Build Pipeline
- Shader Graph
- Test Framework
- TextMeshPro
- Timeline
- Tutorial Authoring Tools
- Tutorial Framework
- Unity Distribution Portal
- Unity Transport
- Universal RP
- Version Control
- Visual Effect Graph
- Visual Studio Code Editor
- Visual Studio Editor
- WebGL Publisher
- Windows XR Plugin
- Xiaomi SDK
- XR Interaction Toolkit
- XR Plugin Management
- Preview packages
- Core packages
- Built-in packages
- AI
- Android JNI
- Animation
- Asset Bundle
- Audio
- Cloth
- Director
- Image Conversion
- IMGUI
- JSONSerialize
- Particle System
- Physics
- Physics 2D
- Screen Capture
- Terrain
- Terrain Physics
- Tilemap
- UI
- UIElements
- Umbra
- Unity Analytics
- Unity Web Request
- Unity Web Request Asset Bundle
- Unity Web Request Audio
- Unity Web Request Texture
- Unity Web Request WWW
- Vehicles
- Video
- VR
- Wind
- XR
- Packages by keywords
- Unity's Package Manager
- How Unity works with packages
- Concepts
- Configuration
- Package Manager window
- Access the Package Manager window
- List view
- Details view
- Finding packages
- Adding and removing packages
- Install a package from a registry
- Install a package from a local folder
- Install a package from a local tarball file
- Install a package from a Git URL
- Removing an installed package from a project
- Disabling a built-in package
- Switching to another package version
- Importing an Asset Store package
- Updating your Asset Store package
- Remove imported assets from a project
- Delete a package from the Asset Store cache
- Finding package documentation
- Inspecting packages
- Scripting API for packages
- Scoped registries
- Resolution and conflict
- Project manifest
- Troubleshooting
- Creating custom packages
- Verified packages
- Working in Unity
- Installing Unity
- Upgrading Unity
- Using the API Updater
- Upgrading to Unity 2020 LTS
- Upgrading to Unity 2019 LTS
- Upgrading to Unity 2018 LTS
- Legacy Upgrade Guides
- Unity's interface
- Create Gameplay
- Editor Features
- Analysis
- Memory in Unity
- Profiler overview
- Profiling your application
- Common Profiler markers
- The Profiler window
- Audio Profiler module
- CPU Usage Profiler module
- Global Illumination Profiler module
- GPU Usage Profiler module
- Memory Profiler module
- Physics Profiler module
- 2D Physics Profiler module
- Rendering Profiler module
- UI and UI Details Profiler
- Video Profiler module
- Virtual Texturing Profiler module
- Profiler Module Editor
- Low-level native plug-in Profiler API
- Profiling tools
- Log files
- Understanding optimization in Unity
- Asset loading metrics
- Asset Workflow
- Input
- 2D game development
- Introduction to 2D
- Gameplay in 2D
- 2D Sorting
- Work with sprites
- Set up sprites
- Sort sprites
- Sprite Renderer
- Sprite Creator
- Sprite Editor
- Sorting Groups
- 9-slicing Sprites
- Sprite Masks
- Sprite Atlas
- Sprite Shape Renderer
- Create with Tilemaps
- Physics 2D Reference
- Graphics
- Render pipelines
- Render pipelines introduction
- How to get, set, and configure the active render pipeline
- Choosing and configuring a render pipeline and lighting solution
- Using the Built-in Render Pipeline
- Using the Universal Render Pipeline
- Using the High Definition Render Pipeline
- Scriptable Render Pipeline fundamentals
- Creating a custom render pipeline
- Cameras
- Lighting
- Introduction to lighting
- Light sources
- Shadows
- The Lighting window
- Lighting Settings Asset
- The Light Explorer window
- Lightmapping
- Realtime Global Illumination using Enlighten
- Light Probes
- Reflection Probes
- Precomputed lighting data
- Scene View Draw Modes for lighting
- Models
- Meshes
- Textures
- Importing Textures
- Texture formats
- Mipmaps
- Render Texture
- Custom Render Textures
- Movie Textures
- 3D textures
- Texture arrays
- Cubemaps
- Cubemap arrays
- Streaming Virtual Texturing
- Streaming Virtual Texturing requirements and compatibility
- How Streaming Virtual Texturing works
- Enabling Streaming Virtual Texturing in your project
- Using Streaming Virtual Texturing in Shader Graph
- Cache Management for Virtual Texturing
- Marking textures as "Virtual Texturing Only"
- Virtual Texturing error material
- Sparse Textures
- Loading texture and mesh data
- Shaders
- Shaders core concepts
- Built-in shaders
- Standard Shader
- Standard Particle Shaders
- Autodesk Interactive shader
- Legacy Shaders
- Using Shader Graph
- Writing shaders
- Writing shaders overview
- ShaderLab
- ShaderLab: defining a Shader object
- ShaderLab: defining a SubShader
- ShaderLab: defining a Pass
- ShaderLab: adding shader programs
- ShaderLab: commands
- ShaderLab: grouping commands with the Category block
- ShaderLab command: AlphaToMask
- ShaderLab command: Blend
- ShaderLab command: BlendOp
- ShaderLab command: ColorMask
- ShaderLab command: Conservative
- ShaderLab command: Cull
- ShaderLab command: Offset
- ShaderLab command: Stencil
- ShaderLab command: UsePass
- ShaderLab command: GrabPass
- ShaderLab command: ZClip
- ShaderLab command: ZTest
- ShaderLab command: ZWrite
- ShaderLab legacy functionality
- HLSL in Unity
- GLSL in Unity
- Example shaders
- Writing Surface Shaders
- Writing shaders for different graphics APIs
- Understanding shader performance
- Materials
- Visual effects
- Post-processing and full-screen effects
- Particle systems
- Choosing your particle system solution
- Built-in Particle System
- Using the Built-in Particle System
- Particle System vertex streams and Standard Shader support
- Particle System GPU Instancing
- Particle System C# Job System integration
- Components and Modules
- Particle System
- Particle System modules
- Particle System Main module
- Emission module
- Shape Module
- Velocity over Lifetime module
- Noise module
- Limit Velocity Over Lifetime module
- Inherit Velocity module
- Lifetime by Emitter Speed
- Force Over Lifetime module
- Color Over Lifetime module
- Color By Speed module
- Size over Lifetime module
- Size by Speed module
- Rotation Over Lifetime module
- Rotation By Speed module
- External Forces module
- Collision module
- Triggers module
- Sub Emitters module
- Texture Sheet Animation module
- Lights module
- Trails module
- Custom Data module
- Renderer module
- Particle System Force Field
- Visual Effect Graph
- Decals and projectors
- Lens flares and halos
- Lines, trails, and billboards
- Sky
- Color
- Graphics API support
- Graphics performance and profiling
- Render pipelines
- World building
- Physics
- Built-in 3D Physics
- Character control
- Rigidbody physics
- Collision
- Introduction to collision
- Continuous collision detection (CCD)
- Create a vehicle with Wheel Colliders
- Physics Debug Visualization
- Box Collider component reference
- Capsule Collider component reference
- Terrain Collider component reference
- Wheel Collider component reference
- Mesh Collider component reference
- Sphere Collider component reference
- Physic Material component reference
- Joints
- Articulations
- Ragdoll physics
- Cloth
- Multi-scene physics
- Built-in 3D Physics
- Scripting
- Setting Up Your Scripting Environment
- Scripting concepts
- Important Classes
- Important Classes - GameObject
- Important Classes - MonoBehaviour
- Important Classes - Object
- Important Classes - Transform
- Important Classes - Vectors
- Important Classes - Quaternion
- ScriptableObject
- Important Classes - Time
- Important Classes - Mathf
- Important Classes - Random
- Important Classes - Debug
- Important Classes - Gizmos & Handles
- Unity architecture
- Plug-ins
- Job system
- Multiplayer and Networking
- Multiplayer Overview
- Setting up a multiplayer project
- Using the Network Manager
- Using the Network Manager HUD
- The Network Manager HUD in LAN mode
- The Network Manager HUD in Matchmaker mode
- Converting a single-player game to Unity Multiplayer
- Debugging Information
- The Multiplayer High Level API
- Multiplayer Component Reference
- Multiplayer Classes Reference
- Multiplayer Encryption Plug-ins
- UnityWebRequest
- Audio
- Audio overview
- Audio files
- Tracker Modules
- Audio Mixer
- Native Audio Plugin SDK
- Audio Profiler
- Ambisonic Audio
- Audio Reference
- Audio Clip
- Audio Listener
- Audio Source
- Audio Mixer
- Audio Filters
- Audio Effects
- Audio Low Pass Effect
- Audio High Pass Effect
- Audio Echo Effect
- Audio Flange Effect
- Audio Distortion Effect
- Audio Normalize Effect
- Audio Parametric Equalizer Effect
- Audio Pitch Shifter Effect
- Audio Chorus Effect
- Audio Compressor Effect
- Audio SFX Reverb Effect
- Audio Low Pass Simple Effect
- Audio High Pass Simple Effect
- Reverb Zones
- Microphone
- Audio Settings
- Video overview
- Animation
- Animation System Overview
- Rotation in animations
- Animation Clips
- Animator Controllers
- Retargeting of Humanoid animations
- Performance and optimization
- Animation Reference
- Animation FAQ
- Playables API
- A Glossary of animation terms
- Creating user interfaces (UI)
- Comparison of UI systems in Unity
- UI Toolkit
- Unity UI
- Immediate Mode GUI (IMGUI)
- Navigation and Pathfinding
- Navigation Overview
- Navigation System in Unity
- Inner Workings of the Navigation System
- Building a NavMesh
- NavMesh building components
- Advanced NavMesh Bake Settings
- Creating a NavMesh Agent
- Creating a NavMesh Obstacle
- Creating an OffMesh Link
- Building OffMesh Links Automatically
- Building Height Mesh for Accurate Character Placement
- Navigation Areas and Costs
- Loading Multiple NavMeshes using Additive Loading
- Using NavMesh Agent with Other Components
- Navigation Reference
- Navigation How-Tos
- Navigation Overview
- Unity Services
- Setting up your project for Unity services
- Unity Organizations
- Unity Ads
- Legacy Analytics
- Legacy Analytics Overview
- Setting Up Legacy Analytics
- Legacy Analytics Dashboard
- Legacy Analytics Events
- Funnels
- Remote Settings
- Unity Analytics A/B Testing
- Monetization
- User Attributes
- Unity Analytics Raw Data Export
- Data reset
- Upgrading Unity Analytics
- COPPA Compliance
- Unity Analytics and the EU General Data Protection Regulation (GDPR)
- Unity Analytics and PIPL
- Analytics Metrics, Segments, and Terminology
- Unity Cloud Content Delivery
- Unity IAP
- Setting up Unity IAP
- Cross Platform Guide
- Codeless IAP
- Defining products
- Subscription Product support
- Initialization
- Browsing Product Metadata
- Initiating Purchases
- Processing Purchases
- Handling purchase failures
- Restoring Transactions
- Purchase Receipts
- Receipt validation
- Store Extensions
- Cross-store installation issues with Android in-app purchase stores
- Store Guides
- Implementing a Store
- Unity Cloud Diagnostics
- Unity Integrations
- Multiplayer Services
- Unity Distribution Portal
- Unity Accelerator
- XR
- Unity's Asset Store
- Asset Store packages
- Publishing to the Asset Store
- Creating your Publisher Account
- Creating a new package draft
- Deleting a package draft
- Uploading assets to your package
- Filling in the package details
- Submitting your package for approval
- Viewing the status of your Asset Store submissions
- Collecting revenue
- Providing support to your customers
- Adding tags to published packages
- Connecting your account to Google Analytics
- Promoting your Assets
- Refunding your customers
- Upgrading packages
- Deprecating your Assets
- Issuing vouchers
- Managing your publishing team
- Asset Store Publisher portal
- Platform development
- Using Unity as a Library in other applications
- Enabling deep linking
- Xcode frame debugger Unity integration
- Standalone
- macOS
- Linux
- tvOS
- WebGL
- iOS
- Integrating Unity into native iOS applications
- Getting started with iOS development
- iOS build settings
- iOS Player settings
- iOS Advanced Topics
- Troubleshooting on iOS devices
- Reporting crash bugs on iOS
- Android
- Android environment setup
- Integrating Unity into Android applications
- Unity Remote
- Android Player settings
- Android Keystore Manager
- Building apps for Android
- Single-Pass Stereo Rendering for Android
- Vulkan swapchain pre-rotation
- Building and using plug-ins for Android
- Android mobile scripting
- Troubleshooting Android development
- Reporting crash bugs under Android
- Chrome OS
- Windows
- Universal Windows Platform
- Introduction to Universal Windows Platform
- Get started with Universal Windows Platform
- Develop for Universal Windows Platform
- Build and deliver for Universal Windows Platform
- Legacy Topics
- Glossary
- Unity User Manual 2020.3 (LTS)
- Scripting
- Setting Up Your Scripting Environment
- Debug C# code in Unity
Debug C# code in Unity
You can use a debugger to inspect your source code while your application is running. Unity supports the following code editors to debug C# code:
- Visual Studio (with the Visual Studio Tools for Unity plug-in)
- Visual Studio for Mac
- Jetbrains Rider
- Visual Studio Code (experimental)
Although these code editors vary slightly in the debugging features they support, they all provide basic functionality such as break points, single stepping, and variable inspection. You can attach these code editors to the Unity Editor or Unity Player to debug your code.
Managed code debugging in Unity works on all platforms except WebGLA JavaScript API that renders 2D and 3D graphics in a web browser. The Unity WebGL build option allows Unity to publish content as JavaScript programs which use HTML5 technologies and the WebGL rendering API to run Unity content in a web browser. More info
See in Glossary. It works with both the MonoA scripting backend used in Unity. More info
See in Glossary and IL2CPPA Unity-developed scripting back-end which you can use as an alternative to Mono when building projects for some platforms. More info
See in Glossary scripting backendsA framework that powers scripting in Unity. Unity supports three different scripting backends depending on target platform: Mono, .NET and IL2CPP. Universal Windows Platform, however, supports only two: .NET and IL2CPP. More info
See in Glossary.
Configure the code editor
Visual Studio (Windows)
The Unity Editor installer includes an option to install Visual Studio with the Visual Studio Tools for Unity plug-inA set of code created outside of Unity that creates functionality in Unity. There are two kinds of plug-ins you can use in Unity: Managed plug-ins (managed .NET assemblies created with tools like Visual Studio) and Native plug-ins (platform-specific native code libraries). More info
See in Glossary. This is the recommended way to set up Visual Studio for debugging with Unity.
If Visual Studio is already installed on your computer, open it and go to Tools > Get Tools and Features… to locate and install the Visual Studio Tools for Unity plug-in.
Visual Studio for Mac
The Unity Editor installer includes an option to install Visual Studio for Mac. This is the recommended way to set up Visual Studio for Mac for debugging with Unity.
If Visual Studio for Mac is already installed on your computer, open it and go to Visual Studio > Extensions > Install from file… to locate and install the Visual Studio Tools for Unity plug-in.
JetBrains Rider
You can use the default installation of JetBrains Rider to debug code in Unity on Windows or Mac. Visit the JetBrains website to install it.
Visual Studio Code
To debug in Unity using Visual Studio Code, you need to install an extension. See Visual Studio Code’s documentation to configure Visual Studio Code as the code editor for your Unity project. Follow Visual Studio Code’s instructions specific to the Debugger for Unity extension to install it. Unity’s support for Visual Studio Code is experimental as Unity does not officially support the Debugger for Unity extension.
Specify the External Script Editor in Unity
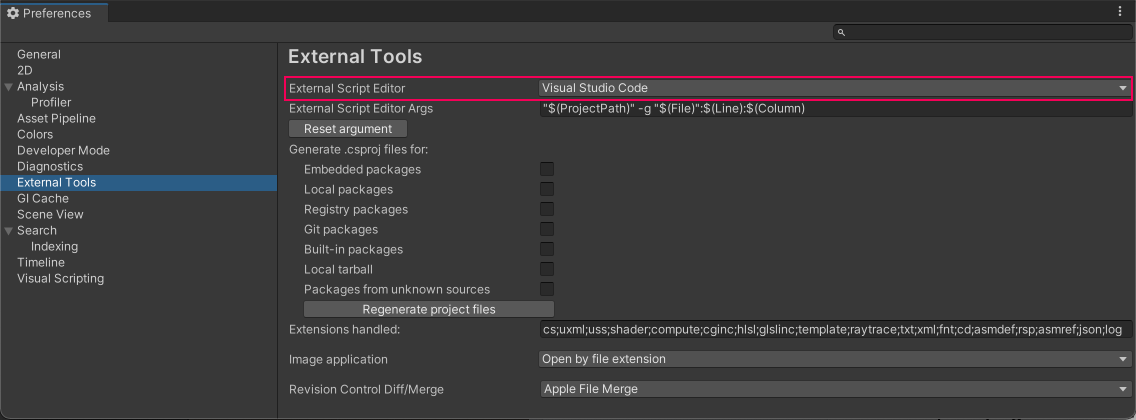
Once you’ve installed a code editor, open Unity, go to Preferences > External Tools and set the External Script Editor to your code editor.
Breakpoints
Breakpoints allow you to specify points in your code where you want to pause its execution. In your external code editor, you can set a breakpoint on a line of code where you want the debugger to stop. While the code editor is at a breakpoint, you can view the contents of variables step by step.
If you have attached your code editor to the Unity Editor (see Attach your code editor to the Unity Editor), the Unity Editor becomes unresponsive until you choose the continue option in your code editor, or stop debugging mode.
To see how you can set breakpoints in Visual Studio see Set breakpoints in Visual Studio.
Debug in the Unity Editor
You can debug C# code as it runs in the Unity Editor while the Unity Editor is in Play Mode.
To debug in the Editor, you need to set the Editor’s Code Optimization mode to Debug Mode, then you can attach a code editor with a debugging feature.
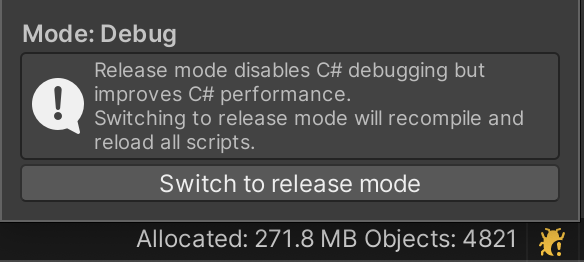
To change the Code Optimization mode, select the Debug Button in the bottom right of the Unity Editor Status Bar.

Unity’s Code Optimization setting has two modes:
- Debug Mode, which you can use to attach external debugger software, but gives slower C# performance when you run your Project in Play Mode in the Editor.
- Release Mode, which gives faster C# performance when you run your Project in Play Mode in the Editor, but you cannot attach any external debuggers.
When you click the Debug button in the status bar, a small pop-up window opens which contains a button you can use to switch modes. The window also displays information about the current mode, and describes what happens if you switch modes.
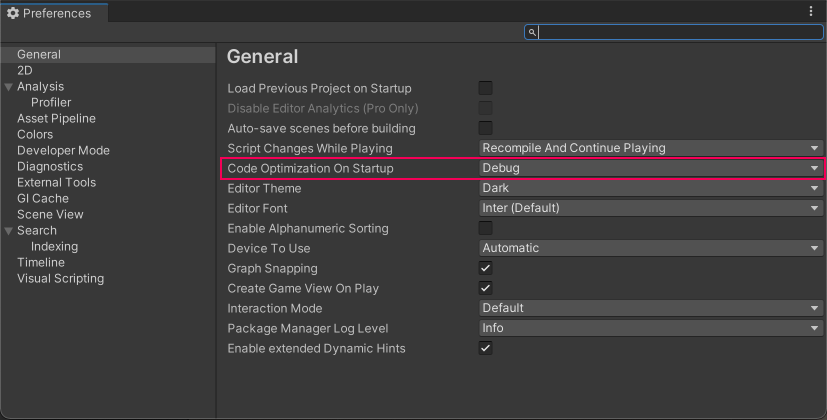
To change which mode the Unity Editor starts up in, go to Edit (macOS: Unity) > Preferences > General > Code Optimization On Startup.
To control these settings using a script, use the following API:
You can also override the mode that the Editor starts up in, or turn off the debugger listen socket. To do this, use the following command line arguments when you launch the Editor:
-
-releaseCodeOptimization. Starts the Editor in Release code optimization mode. -
-debugCodeOptimization. Starts the Editor in Debug code optimization mode. -
-disableManagedDebugger. Starts the Editor with the debugger listen socket disabled.
Attach your code editor to the Unity Editor
The way to attach your code editor to the Unity Editor depends on what code editor you use, and is often a different option from your code editor’s normal debugging process. Some code editors allow you to select an instance of Unity to debug. For instructions specific to your code editor, see Code editor external documentation. To see how you can do this in Visual Studio, see Attach Visual Studio to the Unity Editor.
When you have attached the code editor to the Unity Editor and you are ready to begin debugging, return to the Unity Editor and enter Play Mode.
Debug in the Unity Player
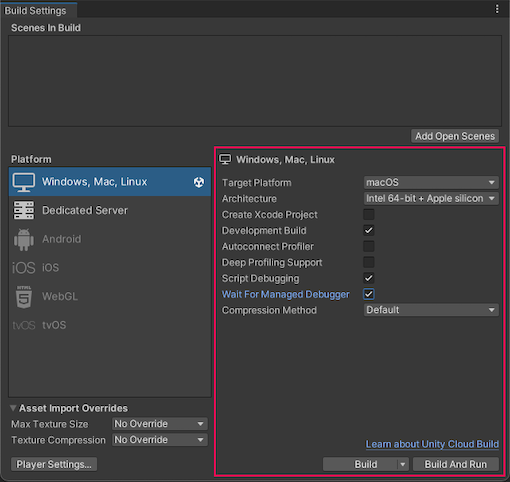
To compile a Unity Player for you to debug:
- Go to File > Build Settings.
- Enable the Development BuildA development build includes debug symbols and enables the Profiler. More info
See in Glossary and Script Debugging options before you build the Player. You could also enable the Wait For Managed Debugger option to make the Player wait for a debugger to be attached before the Player executes any script code. - Select Build And Run.
Attach your code editor to the Unity Player
To attach your code editor to the Unity Player, in your code editor, select the IP address (or machine name) and port of your Player. For an example of where to find this in Visual Studio, see Attach Visual Studio to the Unity Editor.
Note: Your code editor will show all instances of Unity that are available to debug. Make sure you attach the code editor to the correct instance of the Unity Player, and not to the Unity Editor if both are running.
When you have attached the debugger, you can begin debugging normally. For instructions on how to attach the Unity Player to your specific code editor, see Code editor external documentation. For an example of how to attach a Unity Player that runs on a mobile device to Visual Studio, see Debug Android and iOS devices with Visual Studio.
Set breakpoints in Visual Studio
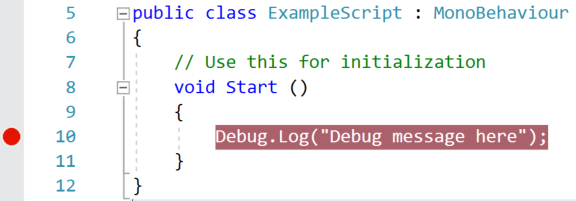
To set a breakpoint in Visual Studio, click on the column to the left of your code, on the line you want to stop the debugger. A red circle appears next to the line number and the line is highlighted.
Attach Visual Studio to the Unity Editor
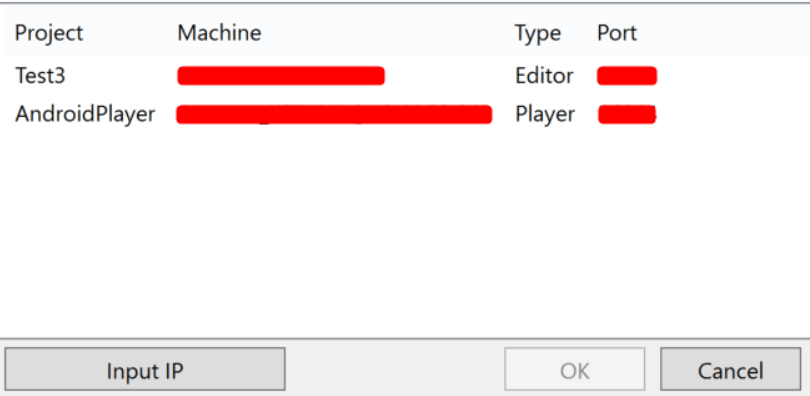
To attach the Unity Editor to your Visual Studio script, open Visual Studio, go to Debug > Attach Unity Debugger and select the instance of the Unity Editor you would like to debug.
In the following example image, there is one instance of Unity running in the Editor and one instance of Unity running as an Android Player
Debug Android and iOS devices with Visual Studio
Android
To debug a Unity Player running on an Android device, connect to the device using USB or TCP. For example, to connect to an Android device in Visual Studio, select Debug > Attach Unity Debugger option. A list of devices running a Player instance appears.
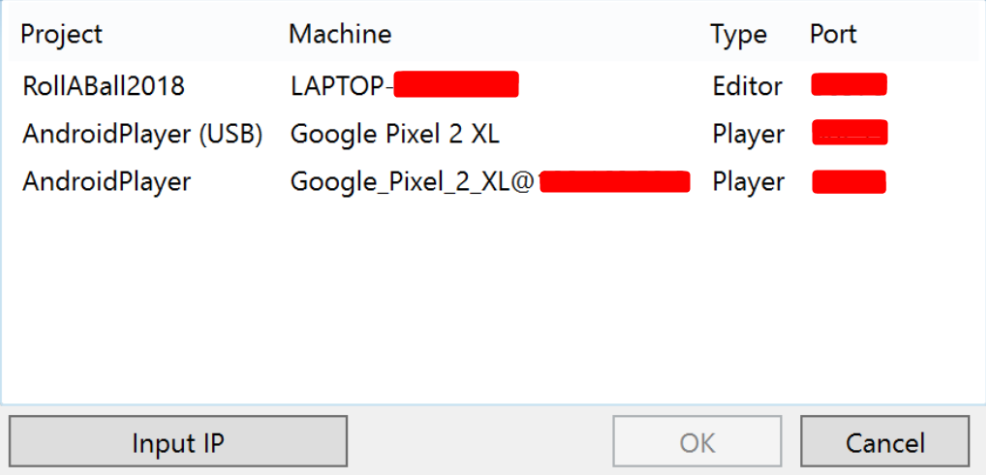
In this example, the android device is connected using USB and Wi-Fi on the same network as the workstation running the Unity Editor and Visual Studio.
Android on Chrome OS
Unity can’t automatically discover Chrome OS devices. To initiate a connection, connect to the device through Android Debug Bridge (adb). For more information about how to use adbAn Android Debug Bridge (ADB). You can use an ADB to deploy an Android package (APK) manually after building. More info
See in Glossary, see the Android Studio User Guide.
iOS
To debug a Unity Player running on an iOS device, connect to the device using TCP. For example, to connect to an iOS device in Visual Studio for Mac, select Debug > Attach Unity Debugger. A list of devices running a Player instance appears.
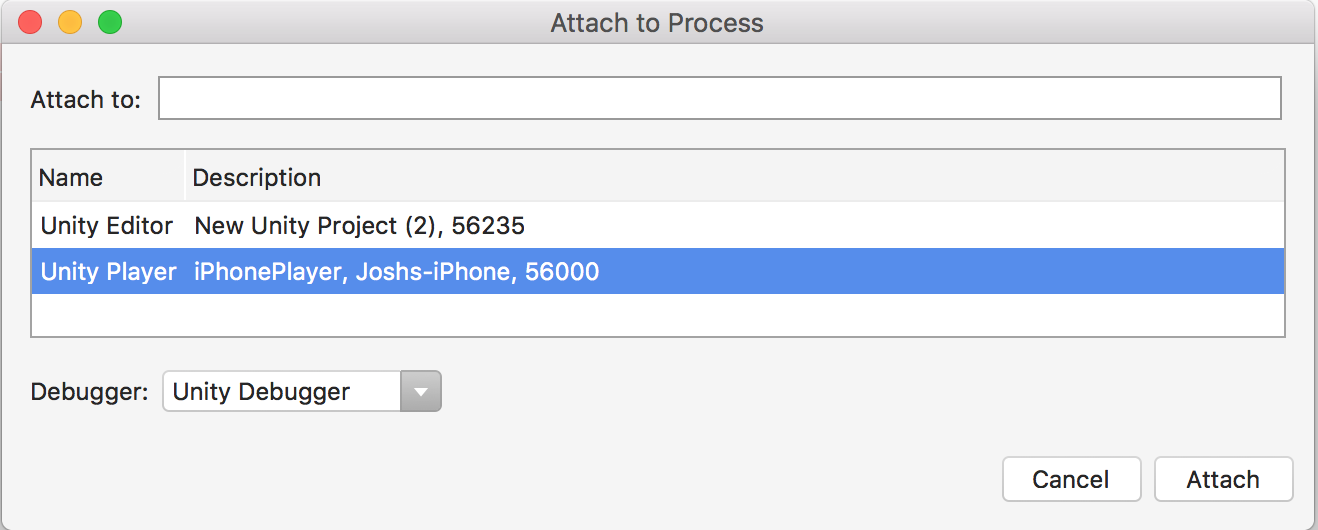
Ensure that the device only has one active network interface (Wi-Fi recommended, turn off cellular data) and that there is no firewall between the IDE and the device blocking the TCP port (port number 56000 in the above screenshot).
Important: iOSApple’s mobile operating system. More info
See in Glossary does not support debugging over USB.
Troubleshoot the debugger
Most problems with the debugger occur because the code editor is unable to locate the Unity Editor or the Unity Player. This means that the Unity Editor or Player can’t attach the debugger properly. Because the debugger uses a TCP connection to the Editor or Player, connection issues are often caused by the network. Below are a few steps you can take to troubleshoot basic connection issues.
Ensure you attach the debugger to the correct Unity instance
You can attach your code editor to any instance of the Unity Editor or Unity Player on the local network that has debugging enabled. When you attach the debugger, ensure that you attach it to the correct Unity instance. If you know the IP address or machine name of the device on which you are running the Unity Player, this helps to locate the correct instance.
Verify the network connection to the Unity instance
The code editor uses the same mechanism to locate a Unity instance to debug as the Unity ProfilerA window that helps you to optimize your game. It shows how much time is spent in the various areas of your game. For example, it can report the percentage of time spent rendering, animating, or in your game logic. More info
See in Glossary. If the code editor can’t find the Unity instance you expect, try to attach the Unity Profiler to that instance. If the Unity Profiler cannot find the Unity instance either, there might be a firewall on the machine you are running the code editor or Unity instance on. If a firewall is in place, see Check the firewall settings.
Ensure the device only has one active network interface
Many devices have multiple network interfaces. For example, a mobile phone might have both an active cellular connection and an active Wi-Fi connection. To properly connect the debugger to the Unity instance using TCP, the IDE needs to make a network connection to the correct interface on the device. If you plan to debug over Wi-Fi, for example, make sure you put the device in airplane mode to disable all other interfaces, then enable Wi-Fi.
You can determine which IP address the Unity Player tells the IDE to use by looking in the Player LogThe .log file created by a Standalone Player that contains a record of events, such as script execution times, the compiler version, and AssetImport time. Log files can help diagnose problems. More info
See in Glossary. Look for a part of the log like this:
Multi-casting "[IP] 10.0.1.152 [Port] 55000 [Flags] 3 [Guid] 2575380029 [EditorId] 4264788666 [Version] 1048832 [Id] iPhonePlayer(Example-iPhone):56000 [Debug] 1 [PackageName] iPhonePlayer" to [225.0.0.222:54997]...
This message indicates the IDE will try to use the IP address 10.0.1.152 and port 56000 to connect to the device. This IP address and port must be reachable from the computer running the IDE.
Check the firewall settings
The Unity instance communicates with the code editor using a TCP connection. On most Unity platforms, this TCP connection occurs on an arbitrarily chosen port. Normally, you shouldn’t need to know this port, as the code editor should detect it automatically. If that doesn’t work, use a network analysis tool to determine which ports might be blocked either on the machine where you are running the code editor, or the machine or device where you are running the Unity instance. When you find the ports, make sure that your firewall allows access to the port on both the machine running the code editor, and the machine running the Unity instance.
Verify the managed debugging information is available
If the debugger attaches to the Unity instance but breakpoints don’t load, the debugger might not be able to locate the managed debugging information for the code. Managed code debugging information is stored in files named .pdb, next to the managed assembly (.dll file) on the disk.
When you enable the correct preferences and build options (see Configure the code editor), Unity generates this debugging information automatically. However, Unity cannot generate debugging information for managed plugins in your project. You can only debug code from managed plugins if the associated .pdb files are next to the managed plugins in the Unity project on disk.
Prevent the device from locking
Disable any screen locks on the device you are using to debug your application. Screen locks cause the debugger to disconnect, and prevent it from re-connecting. Don’t lock the screen during managed code debugging. If the screen locks, restart the application on the device so the debugger can connect again.
Code editor external documentation
- Visual Studio - Using Visual Studio Tools for Unity (Windows)
- Visual Studio for Mac - Using Visual Studio Tools for Unity (macOS)
- Jetbrains Rider - Debug Unity Applications