Manual
- Unity User Manual (2019.4 LTS)
- Packages
- Verified packages
- 2D Animation
- 2D Common
- 2D Path
- 2D Pixel Perfect
- 2D PSD Importer
- 2D SpriteShape
- Adaptive Performance
- Adaptive Performance Samsung Android
- Addressables
- Advertisement
- Alembic
- Analytics Library
- Android Logcat
- AR Foundation
- AR Subsystems
- ARCore XR Plugin
- ARKit Face Tracking
- ARKit XR Plugin
- Asset Bundle Browser
- Barracuda
- Burst
- Core RP Library
- Custom NUnit
- Editor Coroutines
- Google Resonance Audio
- Google VR Android
- Google VR iOS
- High Definition RP
- High Definition RP Config
- In App Purchasing
- Input System
- Lightweight RP
- Magic Leap XR Plugin
- Mathematics
- Mobile Notifications
- Multiplayer HLAPI
- Oculus Android
- Oculus Desktop
- Oculus XR Plugin
- OpenVR Desktop
- Polybrush
- Post Processing
- ProBuilder
- Profile Analyzer
- Quick Search
- Remote Config
- Scriptable Build Pipeline
- Searcher
- Settings Manager
- Shader Graph
- Subsystem Registration
- Test Framework
- TextMesh Pro
- Timeline
- Unity Collaborate
- Universal RP
- Visual Effect Graph
- Vuforia Engine AR
- Windows Mixed Reality
- Windows XR Plugin
- XR Interaction Subsystems
- XR Legacy Input Helpers
- XR Plugin Management
- Preview packages
- 2D Entities
- 2D IK
- AI Planner
- Animation Rigging
- Asset Graph
- Build Report Inspector
- Cinemachine
- Code Coverage
- Collections
- Device Simulator
- DOTS Editor
- Entities
- FBX Exporter
- Film and TV Toolbox
- Game Foundation
- Havok Physics for Unity
- Hybrid Renderer
- Immediate Window
- Jobs
- Kinematica
- Profiler de Memoria
- MeshSync
- ML Agents
- MockHMD XR Plugin
- Package Development
- Package Validation Suite
- Performance testing API
- Platforms
- Platforms Android
- Platforms Linux
- Platforms macOS
- Platforms Web
- Platforms Windows
- PlayableGraph Visualizer
- ProGrids
- Project Tiny Full
- Streaming Image Sequence
- Terrain Tools
- UI Builder
- Unity AOV Recorder
- Unity Distribution Portal
- Unity NetCode
- Unity Physics
- Unity Recorder
- Unity Reflect
- Unity Render Streaming
- Unity Simulation Client
- Unity Simulation Core
- Unity Transport
- Unity User Reporting
- USD
- Vector Graphics
- WebGL Publisher
- WebRTC
- Xiaomi SDK
- XR Interaction Toolkit
- Built-in packages
- 2D Sprite
- 2D Tilemap Editor
- AI
- Android JNI
- Animation
- Asset Bundle
- Audio
- Cloth
- Director
- Image Conversion
- IMGUI
- JSONSerialize
- Particle System
- Physics
- Physics 2D
- Screen Capture
- Subsystems
- Terrain
- Terrain Physics
- Tilemap
- UI
- UIElements
- Umbra
- Unity Analytics
- Unity UI
- Unity Web Request
- Unity Web Request Asset Bundle
- Unity Web Request Audio
- Unity Web Request Texture
- Unity Web Request WWW
- Vehicles
- Video
- VR
- Wind
- XR
- Packages by keywords
- Unity's Package Manager
- Creating custom packages
- Verified packages
- New in Unity 2019
- Working in Unity
- Installing Unity
- Unity's interface
- Asset workflow
- Creación del Gameplay
- Características del Editor
- 2D and 3D mode settings
- Preferences
- Presets
- Shortcuts Manager
- Build Settings
- Project Settings
- Integración Visual Studio C#
- Integración con RenderDoc
- Xcode Frame Debugger integration
- Analiticas del Editor
- Buscar Actualizaciones
- IME en Unity
- Nombres de carpetas de especiales
- Reusing Assets between Projects
- Control de Versiones
- Multi-Scene editing
- Command line arguments
- Support for custom Menu Item and Editor features
- Archivos de escena basados en texto
- Extendiendo el Editor
- Configurable Enter Play Mode
- Solución de Problemas del Editor
- Analysis
- Profiler overview
- Getting started with the Profiler window
- Profiling your application
- Audio Profiler module
- CPU Usage Profiler module
- Global Illumination Profiler module
- GPU Usage Profiler module
- Memory Profiler module
- Physics Profiler module
- 2D Physics Profiler module
- Área de Renderización(Rendering Area)
- UI and UI Details Profiler
- Video Profiler module
- Profiler overview
- Guías de Actualización
- Using the API Updater
- Upgrading to Unity 2019 LTS
- Upgrading to Unity 2018 LTS
- Upgrading to Unity 2017.3
- Upgrading to Unity 2017.2
- Upgrading to Unity 2017.1
- Upgrading to Unity 5.6
- Upgrading to Unity 5.5
- Actualizando a Unity 5.4
- Actualizarse a Unity 5.3
- Actualizándose a Unity 5.2
- Actualizando a Unity 5.0
- Guía de Actualización de Unity 3.5 a 4.0
- Actualizando a Unity 3.5
- Importing
- Input
- 2D
- Experiencia de Juego en 2D
- asdf
- Sprites
- Tilemap
- Physics Reference 2D
- Gráficos
- Render pipelines
- Built-in Render Pipeline
- Universal Render Pipeline
- High Definition Render Pipeline
- Scriptable Render Pipeline
- Scriptable Render Pipeline introduction
- Creating a custom Scriptable Render Pipeline
- Creating a Render Pipeline Asset and Render Pipeline Instance
- Setting the active Render Pipeline Asset
- Scheduling and executing rendering commands in the Scriptable Render Pipeline
- Scriptable Render Pipeline (SRP) Batcher
- Cámaras
- Post-processing
- Lighting
- Introduction to lighting
- Light sources
- Shadows
- The Lighting window
- The Light Explorer window
- Lightmapping
- The Progressive Lightmapper
- Lightmapping using Enlighten (deprecated)
- Lightmapping: Getting started
- Lightmap Parameters Asset
- Directional Mode
- Lightmaps and LOD
- Ambient occlusion
- Lightmaps: Technical information
- Lightmapping and the Shader Meta Pass
- Lightmap UVs
- UV overlap
- Lightmap seam stitching
- Custom fall-off
- Realtime Global Illumination using Enlighten (deprecated)
- Light Probes
- Reflection Probes
- Precomputed lighting data
- Scene View Draw Modes for lighting
- Meshes, Materials, Shaders and Textures
- Componentes Mesh
- Creando y utilizando Materiales
- Texturas 2D
- Sombreadores(Shaders) con Funciones Fijas
- Standard Shader
- Standard Particle Shaders
- Legacy Shaders (Shaders de Legado)
- Referencia del Shader
- Writing Surface Shaders
- Writing vertex and fragment shaders
- Ejemplos del Vertex y Fragment Shader
- Semánticas de Shader
- Accediendo propiedades shader en Cg/HLSL
- Proporcionar datos del vértice a programas vertex
- El Sombreador integrado incluye archivos
- Macros del preprocesador Shader predefinidas
- Funciones Shader integradas de ayuda
- Variables shader integradas
- Shader variants and keywords
- GLSL Shader programs
- Shading language used in Unity
- Niveles Objetivo de Compilación Shader
- Tipos de dato Shader y precisión
- Using sampler states
- Sintaxis ShaderLab
- Assets Shader
- Temas Avanzados de ShaderLab
- Optimizing shader variants
- Asynchronous Shader compilation
- Consejos de rendimiento al escribir shaders
- Rendering con Shaders Remplazados
- Custom Shader GUI (GUI Shader Personalizado)
- Utilizando Depth Textures (Texturas de profundidad)
- La Depth Texture (Textura de Profundidad) de la cámara
- Diferencias especificas de rendering por plataforma
- ShaderLab: SubShader LOD value
- Using texture arrays in shaders
- Debugging DirectX 11/12 shaders with Visual Studio
- Debugging DirectX 12 shaders with PIX
- Implementando la Función Fija TexGen en Shaders
- Tutorial: ShaderLab and fixed function shaders
- Tutorial: vertex and fragment programs
- Particle systems
- Choosing your particle system solution
- Built-in Particle System
- Using the Built-in Particle System
- Particle System vertex streams and Standard Shader support
- Particle System GPU Instancing
- Particle System C# Job System integration
- Components and Modules
- Particle System
- Módulos del Sistema de Partículas
- Particle System Main module
- Emission module
- Módulo Shape (forma)
- Velocity over Lifetime module
- Noise module
- Limit Velocity Over Lifetime module
- Inherit Velocity module
- Force Over Lifetime module
- Color Over Lifetime module
- Color By Speed module
- Módulo Size Over Lifetime
- Módulo Size By Speed
- Rotation Over Lifetime module
- Rotation By Speed module
- External Forces module
- Collision module
- Módulo Triggers
- Sub Emitters module
- Texture Sheet Animation module
- Lights module
- Trails module
- Módulo de datos personalizados
- Renderer module
- Particle System Force Field
- Built-in Particle System examples
- Visual Effect Graph
- Creating environments
- Sky
- Visual Effects Components
- Advanced rendering features
- Optimizando el Rendimiento Gráfico
- Color space
- Graphics tutorials
- Render pipelines
- Física
- Scripting
- Visión General de Scripting
- Creando y usando scripts
- Variables and the Inspector
- Controlar GameObjects utilizando componentes
- Event Functions (Funciones de Evento)
- Administrador del Tiempo y Framerate
- Creando y destruyendo GameObjects.
- Coroutines (corrutinas)
- Namespaces
- Attributes
- Order of Execution for Event Functions
- Understanding Automatic Memory Management
- Compilación dependiente de la plataforma
- Carpetas especiales y orden de compilación script
- Assembly Definitions
- Managed code stripping
- .NET profile support
- Referencing additional class library assemblies
- Stable scripting runtime: known limitations
- Generic Functions
- Scripting restrictions
- Script Serialization
- UnityEvents (Eventos de Unity)
- Qué es una Null Reference Exception? (Excepción con Referencia Null)
- Importando Clases
- "Recetas" para usar Vectores
- JSON Serialization
- ScriptableObject
- Corriendo Código Script del Editor en la Ejecución
- Herramientas de Scripting
- C# Job System
- Plug-ins
- Visión General de Scripting
- Multijugador y Networking (redes)
- Multiplayer Overview
- Configurando un proyecto multijugador
- Using the Network Manager
- Using the Network Manager HUD
- The Network Manager HUD in LAN mode
- The Network Manager HUD in Matchmaker mode
- Converting a single-player game to Unity Multiplayer
- Debugging Information
- La API de Alto Nivel Multijugador
- Multiplayer Component Reference
- Clases Multijugador de referencia
- Multiplayer Encryption Plug-ins
- UnityWebRequest
- Audio
- Vista General del Audio
- Archivos de Audio
- Tracker Modules
- Audio Mixer (Mezclador de Audio)
- Plugin SDK del Audio Nativo de Unity
- Audio Profiler (Perfilador de Audio)
- Ambisonic Audio
- Referencias de Audio
- Audio Clip
- Audio Listener
- Audio Source (Fuente de Audio)
- Audio Mixer (Mezclador de Audio)
- Audio Filters (Filtros de Audio)
- Audio Effects (Efectos de audio)
- Audio Low Pass Effect
- Audio High Pass Effect
- Audio Echo Effect
- Audio Flange Effect
- Audio Distortion Effect
- Audio Normalize Effect
- Audio Parametric Equalizer Effect
- Audio Pitch Shifter Effect
- Audio Chorus Effect
- Audio Compressor Effect
- Audio SFX Reverb Effect
- Audio Low Pass Simple Effect
- Audio High Pass Simple Effect
- Reverb Zones (Zonas de reverberación)
- Micrófono
- Configuraciones de Audio
- Descripción general de video
- Animación
- Visión general del Sistema de Animación
- Clips de Animación (Animation Clips)
- Animator Controllers
- El Asset del Animator Controller
- La Ventana Animator
- Animation State Machines (Máquinas de Estado de Animación)
- Lo básico de los Estados de Maquina
- Parámetros de animación
- Transiciones de State Machine (Estados de Maquina)
- State Machine Behaviours (Comportamientos de Maquinas de Estado)
- Sub-State Machines (Sub-Estados de Maquina)
- Capas de Animación
- Funcionalidad "Solo" y "Mute"
- Target Matching (Haciendo que coincida con un objetivo)
- Inverse Kinematics (Cinemática Inversa)
- Root Motion - Cómo funciona
- Blend Trees (Árboles de Mezcla)
- Working with blend shapes
- Animator Override Controllers
- Retargeting de Animaciones Humanoides
- Performance and optimization
- Animation Reference
- Preguntas más frecuentes de Animación
- Playables API
- Un Glosario de términos de Animación
- User interfaces (UI)
- UIElements Developer Guide
- Unity UI
- Canvas
- Diseño Básico
- Componentes Visuales
- Componentes de Interacción
- Integración de Animación
- Diseño Automático
- Rich Text
- Event System
- Referencia UI
- Rect Transform
- Canvas Components (Componentes del Canvas)
- Componentes Visuales
- Componentes de Interacción
- Auto Layout (Diseño Automático)
- Referencia al Event System (Sistema de Eventos)
- Los cómos del UI
- Immediate Mode GUI (IMGUI)
- Navegación y Pathfinding (Búsqueda de Caminos)
- Visión General de la Navegación
- Sistema de Navegación de Unity
- Trabajos interiores del Sistema de Navegación
- Construyendo un NavMesh
- Componentes de construcción del NavMesh
- Ajustes Bake Avanzados del NavMesh
- Creando un Agente NavMesh
- Creando un NavMesh Obstacle (Obstáculo NavMesh)
- Creando un Off-mesh Link (Enlace Off-mesh)
- Construyendo Off-Mesh Links (Enlaces Off-mesh) Automáticamente
- Construyendo un Height Mesh (Mesh de altura) para una colocación precisa del personaje
- Áreas de Navegación y Costos
- Cargar Múltiples NavMeshes utilizando el Additive Loading
- Utilizando el NavMesh Agent con otros componentes
- Navigation Reference
- Los 'Cómos' de la Navegación
- Visión General de la Navegación
- Servicios de Unity
- Configurando su proyecto para Unity Services
- Unity Organizations
- Unity Ads
- Unity Analytics
- Unity Analytics Overview
- Configurando Analytics
- Analytics Dashboard
- Eventos de analítica
- Funnels
- Configuración remota
- Unity Analytics A/B Testing
- Monetization (Monetización)
- User Attributes (Atributos de Usuario)
- Unity Analytics Raw Data Export (Exportación de datos sin procesar)
- Restablecimiento de datos
- Actualizando Unity Analytics
- COPPA Compliance
- Unity Analytics and the EU General Data Protection Regulation (GDPR)
- Métricas, segmentos y terminología de Analytics
- Unity Cloud Build
- Automated Build Generation
- Supported platforms
- Versiones soportadas de Unity
- Sistemas de control de versiones
- Using the Unity Developer Dashboard to configure Unity Cloud Build for Git
- Using the Unity Editor to configure Unity Cloud Build for Git
- Using the Unity Developer Dashboard to configure Unity Cloud Build for Mercurial
- Using the Unity Editor to configure Unity Cloud Build for Mercurial
- Utilizar Apache Subversion (SVN) con Unity Cloud Build
- Using the Unity Developer Dashboard to configure Unity Cloud Build for Perforce
- Using the Unity Editor to configure Unity Cloud Build for Perforce
- Using the Unity Developer Dashboard to configure Unity Cloud Build for Plastic
- Construyendo para iOS
- Opciones Avanzadas
- Using Addressables in Unity Cloud Build
- Manifest de la construcción
- Cloud Build REST API
- Unity IAP
- Configurando el Unity IAP
- Guia Multi Plataforma
- Codeless IAP
- Definiendo productos
- Subscription Product support
- Inicialización
- Mirando Metadata del Producto
- Iniciando Compras
- Procesando Compras
- Manejando fallas en las compras
- Recuperando Transacciones
- Recibos de Compra
- Validación de Recibo
- Extensiones de la Store (tienda)
- Cross-store installation issues with Android in-app purchase stores
- Guías de Tiendas
- Implementando una Tienda
- Unity Collaborate
- Setting up Unity Collaborate
- Agregar miembros del equipo a su Proyecto de Unity
- Ver el historial
- Habilitando Cloud Build con Collaborate
- Gestión de versiones del ediitor de Unity
- Revirtiendo archivos
- Resolviendo conflictos de archivo
- Excluding Assets from publishing to Collaborate
- Publicar archivos individuales a Collaborate
- Restoring previous versions of a project
- Notificaciones de edición en progreso
- Managing cloud storage
- Moving your Project to another version control system
- Unity Accelerator
- Consejos para solucionar problemas de Collaborate
- Unity Cloud Diagnostics
- Unity Integrations
- Servicios Multiplayer
- Unity Distribution Portal
- XR
- Repositorios Open-source
- Cómo contribuir a Unity
- Paso 1: Obtener una cuenta de Bitbucket
- Paso 2: Fork el repositorio al cual usted quiere contribuir
- Step 3: Clone Su Fork
- Paso 4: Aplique las modificaciones a su fork
- Paso 5: Abra una solicitud Pull en Bitbucket
- Paso 6: Espere al Feedback (retroalimentación)
- Lecturas Adicionales
- FAQ (Preguntas más frecuentes)
- Cómo contribuir a Unity
- Asset Store Publishing
- Creating your Publisher Account
- Creating a new package draft
- Deleting a package draft
- Uploading Assets to your package
- Filling in the package details
- Submitting your package for approval
- Viewing the status of your Asset Store submissions
- Collecting revenue
- Providing support to your customers
- Adding tags to published packages
- Connecting your account to Google Analytics
- Promoting your Assets
- Refunding your customers
- Upgrading packages
- Deprecating your Assets
- Issuing vouchers
- Managing your publishing team
- Asset Store Publisher portal
- Platform development
- Using Unity as a Library in other applications
- Enabling deep linking
- Standalone
- macOS
- Apple TV
- WebGL
- WebGL Player settings
- Empezar con el desarrollo de WebGL
- Compatibilidad del navegador con WebGL
- Building and running a WebGL project
- WebGL: Deploying compressed builds
- Server configuration for WebAssembly streaming
- Debugging and troubleshooting WebGL builds
- Gráficas WebGL
- WebGL Networking (redes)
- Utilizando Audio en WebGL
- Consideraciones de rendimiento WebGL
- Embedded Resources on WebGL
- Memory in WebGL
- WebGL: Interacting with browser scripting
- Utilizando plantillas WebGL
- Bloqueo del cursor y modo de pantalla completa en WebGL
- Input en WebGL
- iOS
- Integrating Unity into native iOS applications
- Iniciando con desarrollo iOS
- iOS build settings
- iOS Player settings
- Temas Avanzados de iOS
- Troubleshooting on iOS devices
- Reportando bugs de falla en iOS
- Android
- Windows
- Integrating Unity into Windows and UWP applications
- Windows General
- Universal Windows Platform
- Cómo empezar
- Universal Windows Platform: Deployment
- Universal Windows Platform (UWP) build settings
- Windows Device Portal Deployment
- Universal Windows Platform: Profiler
- Universal Windows Platform: Command line arguments
- Universal Windows Platform: Association launching
- Clase AppCallbacks
- Universal Windows Platform: WinRT API in C# scripts
- Universal Windows Platform Player Settings
- Universal Windows Platform: IL2CPP scripting back end
- FAQ (Preguntas más frecuentes)
- Universal Windows Platform: Ejemplos
- Universal Windows Platform: Code snippets
- Known issues
- Lista de Verificación para Desarrolladores en Móviles
- Experimental
- Tópicos de legado
- Guía de mejores prácticas
- Expert guides
- Glossary
- Unity User Manual (2019.4 LTS)
- Working in Unity
- Analysis
- Profiler overview
- CPU Usage Profiler module
CPU Usage Profiler module
The CPU Usage Profiler module contains a chart that displays where time is spent in your application. It provides an overview of all the significant areas where your application spends time, such as on rendering, its scripts, and animation. This section of the documentation covers:
- Chart categories
- Module details pane
- Timeline view
- Hierarchy and Raw Hierarchy view
- Allocation call stacks
- Common samples
Chart categories
The CPU Usage Profiler module’s chart tracks the time spent on the application’s main thread. The timings are divided into nine categories. To change the order of the categories in the chart, you can drag and drop them in the chart’s legend. You can also click a category’s colored legend to toggle its display.
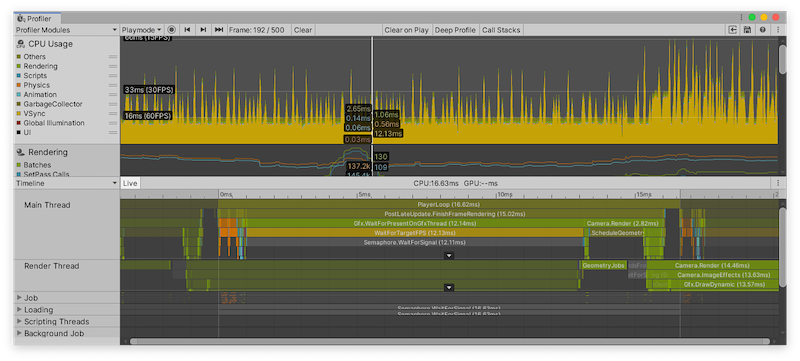
| Category | Descripción |
|---|---|
| Rendering | How much time your application spends on rendering graphics. |
| Scripts | How much time your application spends on running scripts. |
| Physics | How much time your application spends on the physics engine. |
| Animación | How much time your application spends on animating Skinned Mesh Renderers, GameObjects and other components in your application. This also includes the time spent on calculations for systems the Animation and Animator components use. |
| GarbageCollector | How much time your application spends on running the Garbage Collector. |
| VSync | How much time your application spends per frame waiting for the targetFrameRate or the next VBlank to sync with. This is according to the QualitySettings.vSyncCount value, the target framerate, or the VSync setting that is the default or enforced maximum of the platform your application is running on. For more information about VSync, see the section in this documentation on Rendering and VSync samples. |
| Global Illumination | How much time your application spends on lighting. |
| UI | How much time your application spends on displaying its UI. |
| Others | How much time your application spends on code that does not fall into any of the other categories. This includes areas like the entire EditorLoop, or the Profiling overhead when you profile Play Mode in the Editor. |
Module details pane
When you select the CPU Usage module, the details pane below it displays a breakdown of where the application spent time in the selected frame. You can display the timing data as either a timeline or a hierarchical table. To change the display, use the top-left dropdown in the details pane (set to Timeline by default). The three views available are:
| View | Función: |
|---|---|
| Timeline | Displays a breakdown of the timings for a particular frame, alongside a time axis of the frame’s length. This is the only view mode that you can use to see timings on all threads at once and at the times within the frame at which they happened, so that you can correlate timings across threads (for example, Job System worker threads starting up after a system on the main thread schedules them). |
| Hierarchy | Groups the timing data by its internal hierarchical structure. This option displays the elements that your application called in a descending list format, ordered by the time spent by default. You can also order the information by the amount of scripting memory allocated (GC Alloc), or the number of calls. To change the column that orders the table, click the table column’s header. |
| Raw Hierarchy | Displays the timing data in a hierarchical structure that is similar to the call stacks where the timing occurred. Unity lists each call stack separately in this mode instead of merging them, as it does in Hierarchy view. |
Live setting
The Live setting, which is available in each of the views, displays the information about the current or selected frame in the module details pane when you start recording new data in Playmode or the Editor. To enable this, click the Live button next to the module details dropdown. By default, this setting is disabled, and the module details pane is blank when you record data. Note: This setting increases the overhead of the EditorLoop when the Profiler window is repainted.
Show Full Scripting Method Names setting
Additionally, in each view, you can select the More Items menu (⋮) and enable Show Full Scripting Method Names, which then displays the fully qualified names for all scripting methods (Assembly::Class::MethodName).
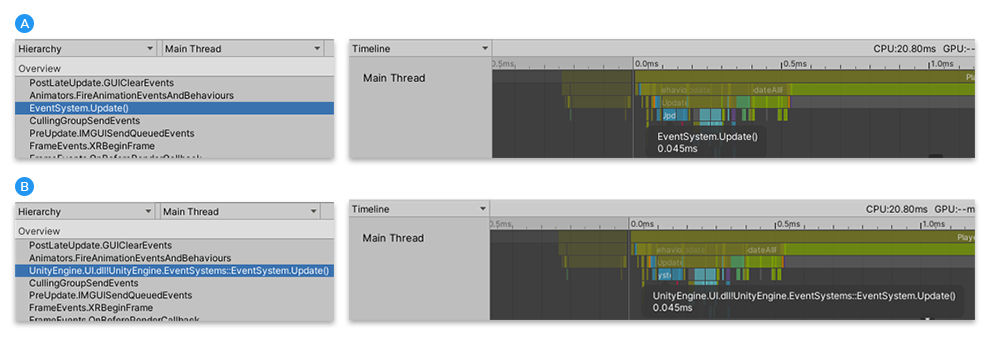
B: Scripting methods in the Hierarchy view and Timeline view with Show Full Scripting Method Names enabled
Timeline view
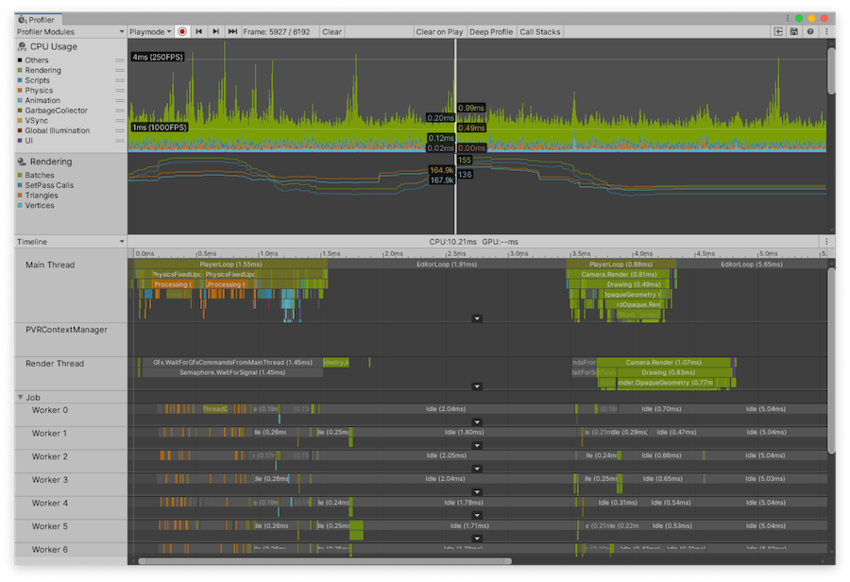
The Timeline view is the default view for the CPU Usage Profiler module. It contains an overview of where time is spent in your application and how the timings relate to each other. The Timeline view displays profiling data from all threads in their own subsections and along the same time axis, unlike the Hierarchy views. The Hierarchy views only display profiling data one thread at a time, defaulting to the main thread. Also, these views only show a sample’s duration, whereas the Timeline view shows at which times each sample occurred.
You can use the Timeline view to see how activities on the different threads correlate to each other in their parallel execution. You can see how much or little you are using the different threads, such as the Job System’s worker threads, how work on the threads are queued up, and if any thread is idling (Idle sample) or waiting for another thread or a Job to finish (Wait for x sample).
Navigating and selecting items
To zoom in on areas of the time axis, use the scroll wheel on your mouse, or press and hold the Alt key while you drag with the right mouse button pressed down. You can also use the ends of the horizontal scrollbar to zoom in. Press the A key on your keyboard to reset the zoom so that the entire frame time is visible.
Whenever you see a white arrow on the bottom of a thread, you can click it to unfold the thread to show all lines, or click again to show only the top ones. You can also drag the line that separates the threads to readjust how many lines you can see. Double-clicking the line sets the height of the thread’s section to the maximum depth of the call stack. To pan the view, press the middle mouse button, or hold the Alt key (Command key on macOS) and press the left mouse button.
To collapse and expand groups of threads, click on the foldout arrows next to the thread names on the far left of the view.
To see an item’s contribution to the CPU chart, select it in the lower pane. The Profiler highlights its contribution, and dims the rest of the chart. To deselect the item, click elsewhere in the view. Press the F key to focus the current sample you selected, or to show the default zoom level if you’ve selected nothing.
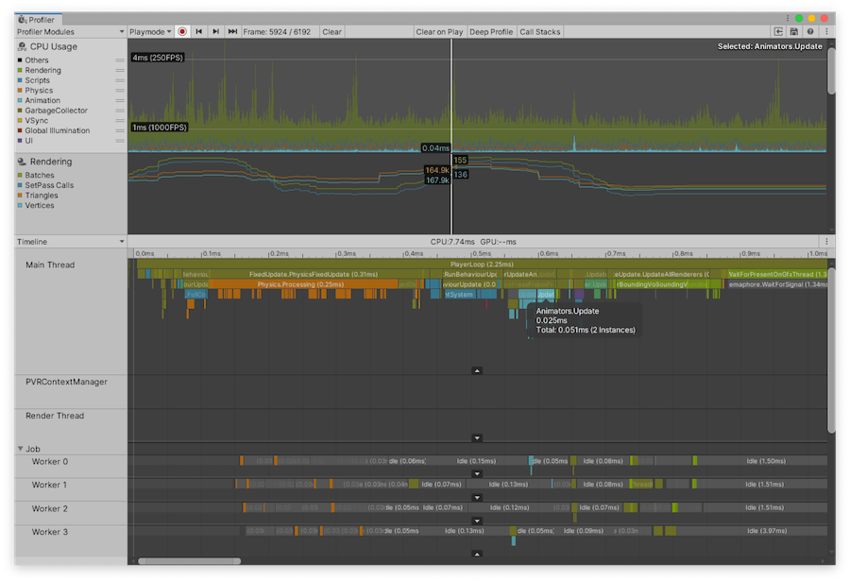
In the image above, the tooltip on the selected item provides further details, such as the number of instances and the total time of this sample across all threads. GC.Alloc samples appear colored in red-magenta, and show you the size of the allocation.
To show managed call stacks in the tooltip, navigate to the Profiler window’s toolbar, and select the Call Stacks button. You must enable this property before you profile a frame to display the call stack for a frame. For more information, see the section on Allocation call stacks.
Hierarchy and Raw Hierarchy view
When you switch to the Hierarchy or Raw Hierarchy view, your selection carries over, as long as the sample is on the main thread. If you cannot immediately find your selection, press the F key to focus it.
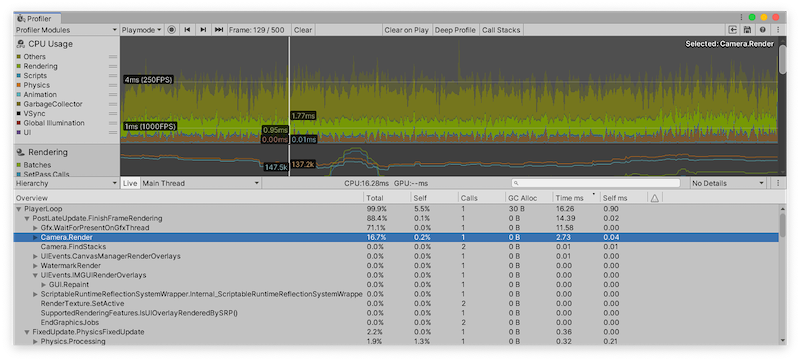
The Hierarchy view lists all samples you have profiled and groups them together by their shared call stack and the hierarchy of ProfilerMarkers. The Raw Hierarchy view does not group samples together, which makes it ideal for looking into samples on a granular level. You can also use the Thread dropdown to select a specific thread, like the Main Thread or Render Thread to inspect in these views.
By default, all EditorOnly samples are collapsed in these views. EditorOnly samples are samples in the Player Loop that only happen because of Editor-only safety checks. When the samples are collapsed, their GC.Alloc value does not contribute to the GC.Alloc value of their enclosing sample. To display these samples, select the More Items menu (⋮) in the top right of the details pane, and then disable the Collapse EditorOnly Samples setting. For more information, see the Editor only samples section of this documentation.
Both views display the following detailed information for each item in the Hierarchy, next to each row:
| Propiedad: | Función: |
|---|---|
| Total | The total amount of time Unity spent on a particular function, as a percentage. |
| Self | The total amount of time Unity spent on a particular function as a percentage, excluding the time Unity spends calling sub-functions. For example, in the screenshot, 16.7% of time is spent in the Camera.Render function. This is because it calls a lot of drawing and culling functions. However, when you exclude the functions it calls, only 0.2% of time is spent on the Camera.Render function itself. |
| Calls | The number of calls made to this function in this frame. In the Raw Hierarchy view the values in this column are always 1 because the Profiler does not merge the hierarchy of samples. |
| GC Alloc | How much scripting heap memory Unity has allocated in the current frame. The scripting heap memory is managed by the garbage collector. Whenever Unity calls GC.Collect() or there is a scripting heap allocation that does not fit within the heap’s current size, the garbage collector triggers. It marks all allocations that have no more references to them and collects them. This process appears as GC.Collect samples in the Profiler. Unity runs the garbage collector more frequently as you allocate more on the heap. As the managed heap grows, it takes Unity longer to mark and collect the memory. As such, you should keep the GC Alloc value at zero while your application runs, to prevent the garbage collector from affecting your framerate, and keep the overall heap size small. For more details about the managed heap see the documentation on Understanding Automatic Memory Management. |
| Time ms | The total amount of time Unity spent on a particular function, in milliseconds. If your application uses the Job System or multithreaded rendering, this information might be misleading, because it only contains the time Unity spent on the currently selected thread. To change the thread, select the Thread dropdown at the top of the Hierarchy pane. |
| Self ms | The total amount of time Unity spent on a particular function, in milliseconds, excluding the time Unity spends calling sub-functions. |
| Warning | Indicated by a warning icon, this displays how many times the application has triggered a warning during the current frame. For more information, see the Performance warnings section of this documentation. |
To get more information about where your application calls and uses the profiled functions, select the Details dropdown at the top right hand corner of the module details pane and choose either Show Related Objects or Show Calls view.
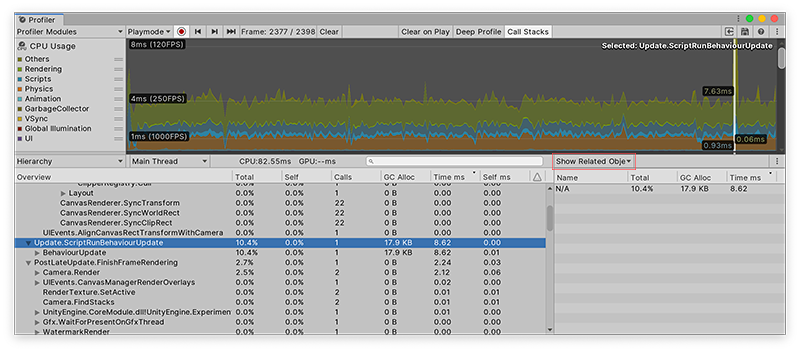
The Show Related Objects view displays a list of UnityEngine.Objects that use a Begin() overload and are associated with the Profiler sample. Some samples that Unity reports have these associations built in, such as Camera.Render samples that are linked to the Camera GameObject that does the rendering. Unity reports these objects via their instance ID and resolves them to a name in the Profiler window, if you profile in the Editor. When you profile a built player, or load a capture from disk, these names do not appear and the Profiler displays them as N/A.
When you click on one of these objects, Unity tries to find the object via the Scene hierarchy and ping it. Because the association uses the instance ID, pinging only works when you profile your application in the Editor, and for as long as the object still exists.
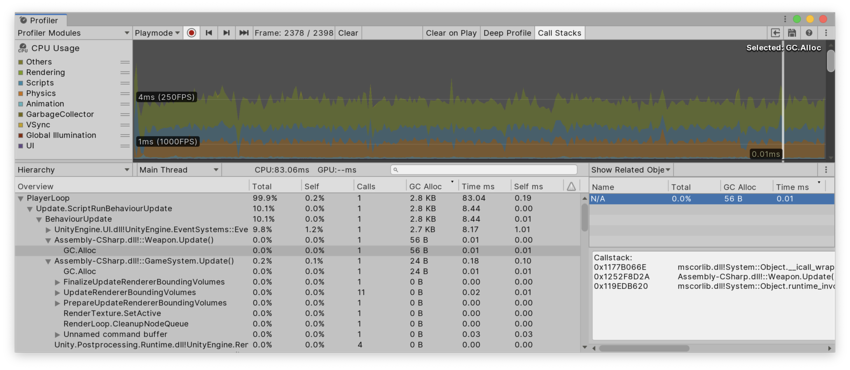
For GC.Alloc samples, this view displays a list of N/A items, one for each allocation that happened at this hierarchy level, with the size of the allocation listed in the GC.Alloc column. If you profile your application with the Call Stacks setting enabled, when you select a GC.Alloc sample in this view, the Profiler window displays the call stack for the allocated scripting object you select, even if you did not enable the Deep Profiling setting. For more information, see the Allocation call stacks section of this documentation.
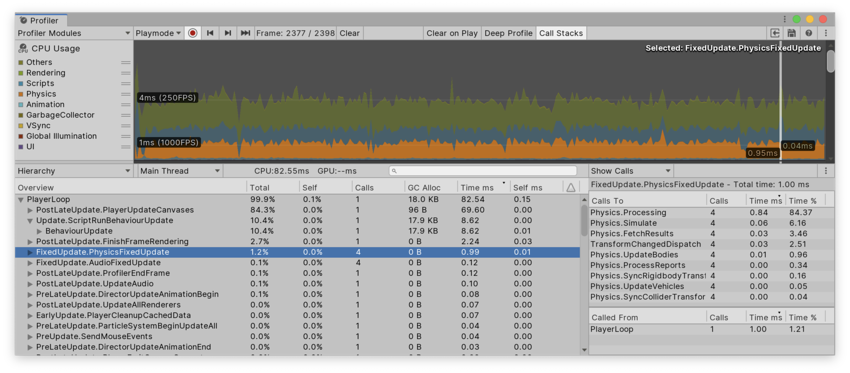
The Show Calls view displays where the selected sample is being called from as well as what other functions it calls to.
Allocation call stacks
By default, allocated call stacks on GC.Alloc samples are disabled, because they can disrupt your application with multi frame delay. However, you sometimes might want to see the full call stack to see how Unity executes your code.
To do this, navigate to the toolbar of the Profiler window, and select the Call Stacks button. You can use this functionality whether you profile in the Editor or on a running Player. In the frames you profile after you turn this option on, the GC.Alloc samples contain their callstacks.
Every scripting heap allocation shows up as a GC.Alloc sample in both the Hierarchy view and Timeline view. In Timeline view, it is colored bright magenta. To see a call stack, select the CPU Profiler Module and select a GC.Alloc sample in Timeline view. The call stack appears in the selection highlight.
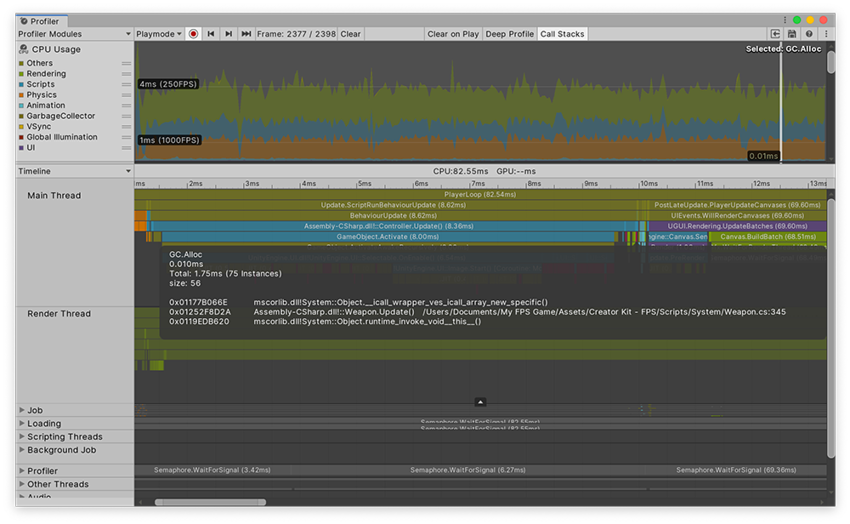
Alternatively you can see the call stack in Hierarchy or Raw Hierarchy view. Set the Details view to Show Related Objects. Because GC.Alloc samples have no name, they show up as N/A in this panel. When you select an N/A object, the Profiler displays the call stack in the bottom half of the details view.
For more information about managed allocations, see documentation on Understanding Automatic Memory Management.
Common samples
As well as samples that your scripting code generates, Unity provides a large number of samples that give you some insight into what is taking up time in your application. The following tables explain what some of the more common samples do.
Main thread base samples
The main thread base samples provide a clear separation between the time spent on your application and time spent on the Editor and Profiler activities. The Recorder can also use these samples to get the timing of a frame on the main thread.
| Sample | Función: |
|---|---|
| PlayerLoop | The root to any samples that originate from your application’s main loop. When you target the Editor instead of Playmode while the Player is running in the Editor in active Play Mode, this sample nests under the EditorLoop. |
| EditorLoop | The root to any samples that originate from the Editor’s main loop. This is only present while you profile a player in the Editor. When you target Playmode with the Profiler, this sample shows how much time of the frame was spent rendering and running the Editor that contains the Player. If you want to see what the Editor does in this time, switch the target to the Editor instead. |
| Profiler.CollectEditorStats | The root for any samples that relate to collecting stats for different active Profiler modules. Any sample under the child sample Profiler.CollectGlobalStats incurs an overhead on the Player. All other child samples only affect the Editor. To turn specific modules off, close their chart or call Profiler.SetAreaEnabled(). |
Script update samples
Unless you are using the Job System, most of your scripting code is nested underneath the following samples:
| Sample | Función: |
|---|---|
| Update.ScriptRunBehaviourUpdate | This sample includes calls to MonoBehaviour.Update and processing of coroutines. |
| BehaviourUpdate | This sample processes all Update() methods. |
| CoroutinesDelayedCalls | Contains coroutine samples after their first yield. |
| PreLateUpdate.ScriptRunBehaviourLateUpdate | This sample processes all LateUpdate() methods. |
| FixedBehaviourUpdate | This sample processes all FixedUpdate() methods. |
Rendering and VSync samples
These samples show where the CPU spends time processing data for the GPU, or where it might be waiting for the GPU to finish. If the GPU Profiler is not available, or it is adding too much overhead, the toolbar does not show this information. These samples can give you an idea of if your application is CPU-bound or GPU-bound.
| Sample | Función: |
|---|---|
| WaitForTargetFPS | The time your application spends waiting for the targeted FPS that Application.targetFrameRate specifies. If this sample is a sub-sample of Gfx.WaitForPresentOnGfxThread, it represents the amount of time that your application spends waiting for the VSync configured in QualitySettings.vSyncCount. Note: The Editor doesn’t VSync on the GPU and instead uses WaitForTargetFPS to simulate the delay for VSync. Some platforms, in particular Android and iOS, enforce VSync or have a default frame rate cap of 30 or 60. |
| Gfx.ProcessCommands | Contains all processing of the rendering commands on the render thread. Some of that time might be spent waiting for VSync or new commands from the main thread, which you can see from it’s child sample Gfx.WaitForPresentOnGfxThread. |
| Gfx.WaitForCommands | Indicates that the render thread is ready for new commands and might indicate a bottle neck on the main thread. |
| Gfx.PresentFrame | Indicates the time your application spends waiting for the GPU to render and present the frame, which might include waiting for VSync. A WaitForTargetFPS sample on the main thread shows how much of that time is spent waiting for VSync. |
| Gfx.WaitForPresentOnGfxThread | Indicates that the main thread is ready to start rendering the next frame, but the render thread has not finished waiting on the GPU to present the frame. This might indicate that your application is GPU-bound. To see what the render thread is simultaneously spending time on, check the Timeline view. If the render thread spends time in Camera.Render, your application is CPU-bound and might be spending too much time sending draw calls or textures to the GPU. If the render thread spends time in Gfx.PresentFrame, your game is GPU-bound or it might be waiting for VSync on the GPU. A WaitForTargetFPS sub-sample of Gfx.WaitForPresentOnGfxThread indicates the portion of the Present phase that your application spends waiting for VSync. The Present phase is the portion of time between Unity instructing the graphics API to swap the buffers, to the time that this operation is completed |
| Gfx.WaitForRenderThread | Indicates that the main thread is waiting for the render thread to process all the commands currently in its command stream. This sample only occurs in multithreaded rendering. |
Multi threading samples
These samples do not consume CPU cycles but instead highlight information that relates to threading and the JobSystem. When you see these samples, use the Timeline view to check what’s happening on other threads at the same time.
| Sample | Función: |
|---|---|
| Idle | Any time that the JobSystem does not utilize a Worker Thread, it emits an Idle sample. Small gaps between Idle samples usually happen when the JobSystem wakes them up, for example to schedule new Jobs. Longer gaps indicate a native Job that has not been instrumented. |
| Semaphore.WaitForSignal | This thread is waiting for something to finish on another thread. To find the thread it is waiting for, check the Timeline view for any samples that ended shortly before this one. |
| WaitForJobGroupID | A Sync Fence on a JobHandle was triggered. This might lead to work stealing, which happens when a worker finishes its work and then looks at other workers’ jobs to complete. These show up as job samples executed under this sample. Jobs that were “stolen” are not necessarily the jobs that were being waited on. |
Physics samples
The following table outlines some of the high-level physics Profiler samples. FixedUpdate() calls all of these samples.
| Sample | Función: | |
|---|---|---|
| Physics.Simulate | Updates the state of the current physics by instructing the physics engine to run its simulation. | |
| Physics.Processing | Processes all non-cloth physics jobs. Expand this sample to show the low-level detail of the work done internally in the physics engine. | |
| Physics.ProcessingCloth | Processes all cloth physics jobs. Expand this sample to show the low-level detail of the work done internally in the physics engine. | |
| Physics.FetchResults | Collects the results of the physics simulation from the physics engine. | |
| Physics.UpdateBodies | Updates all the physics bodies’ positions and rotations. This sample also contains messages that communicate when these updates are sent. | |
| Physics.ProcessReports | Runs once the physics FixedUpdate ends. Processes the various stages of responding to the results of the simulation. Contacts, joint breaks and triggers update and message in this sample. There are four distinct sub stages: |
|
| Physics.TriggerEnterExits | Processes OnTriggerEnter and OnTriggerExit events. |
|
| Physics.TriggerStays | Processes OnTriggerStay events. |
|
| Physics.Contacts | Processes OnCollisionEnter, OnCollisionExit, and OnCollisionStay events. |
|
| Physics.JointBreaks | Processes updates and messages relating to broken joints. | |
| Physics.UpdateCloth | Contains updates relating to cloth and their Skinned Meshes. | |
| Physics.Interpolation | Manages the interpolation of positions and rotations for all the physics objects. | |
To learn more about script life cycles and general samples within a script life cycle, see Order of Execution for Event Functions.
Performance warnings
The CPU Profiler can detect some common performance issues and warn you about them. These appear in the Warning column of the Hierarchy view in the module details pane.
The Profiler can detect some specific calls that you should avoid in performance-critical contexts. It displays the warnings with the reasons the operations are affecting performance as follows:
- Rigidbody.SetKinematic: recreate non-convex MeshCollider for Rigidbody
- Animation.DestroyAnimationClip: triggers RebuildInternalState
- Animation.AddClip: triggers RebuildInternalState
- Animation.RemoveClip: triggers RebuildInternalState
- Animation.Clone: triggers RebuildInternalState
- Animation.Deactivate: triggers RebuildInternalState
Editor only samples
Some samples are only present when you are profiling in the Editor. This includes security checks like the GetComponentNullErrorWrapper, which helps to identify a null component usage; CheckConsistency, which validates object setup; CheckAllowDestructionRecursive, which is a destruction check; and Prefab-related activities. All of these samples are not present in the Player.
By default, Editor-only samples are collapsed in the Hierarchy view, and are named EditorOnly [SampleName]. While they might cause garbage collection allocation, they do not contribute to the GC.Alloc value of their enclosing sample if they are collapsed.
To change the default behavior, click the context menu in the top right of the module details pane and disable the Collapse EditorOnly Samples setting. When you do this, you can expand the sample and contribute its GC.Alloc value to the enclosing sample.
This option does not affect the Timeline view. You can usually ignore these samples, or use them as a prompt to profile Player builds on target devices to find actual issues.