手册
- Unity User Manual (5.6)
- Working In Unity
- Basics
- 资源工作流程
- 主要窗口
- 创建游戏玩法
- 编辑器功能
- 高级开发
- Editor 高级主题
- 许可证和激活
- 升级指南
- 2D
- 图形
- 图形概述
- 光照
- 摄像机
- 材质、着色器和纹理
- 纹理
- 创建和使用材质
- 标准着色器
- 通过脚本访问和修改材质参数
- 编写着色器
- 旧版着色器
- 内置着色器的用途和性能
- 普通着色器系列
- 透明着色器系列
- 透明镂空着色器系列
- 自发光着色器系列
- 反光着色器系列
- 反射顶点光照 (Reflective Vertex-Lit)
- 反光漫射 (Reflective Diffuse)
- 反光镜面反射 (Reflective Specular)
- 反光凹凸漫射 (Reflective Bumped Diffuse)
- 反光凹凸镜面反射 (Reflective Bumped Specular)
- 反光视差漫射 (Reflective Parallax Diffuse)
- 反光视差镜面反射 (Reflective Parallax Specular)
- 反光法线贴图无光照 (Reflective Normal Mapped Unlit)
- 反光法线贴图顶点光照 (Reflective Normal mapped Vertex-lit)
- 视频概述
- 地形引擎
- Tree Editor(树编辑器)
- 粒子系统
- 后期处理概述
- 反射探针
- 集群渲染
- 高级渲染功能
- Procedural Materials
- 程序化网格几何体
- 优化图形性能
- 层
- 图形参考
- 摄像机参考
- 着色器参考
- 粒子系统参考
- 粒子系统 (Particle System)
- 粒子系统模块
- 粒子系统 (Particle System) 主模块
- Emission 模块
- Shape module
- Velocity Over Lifetime module
- Noise 模块
- Limit Velocity Over Lifetime 模块
- Inherit Velocity 模块
- Force Over Lifetime 模块
- Color Over Lifetime 模块
- Color By Speed 模块
- Size over Lifetime 模块
- Size by Speed 模块
- Rotation Over Lifetime 模块
- Rotation By Speed 模块
- External Forces 模块
- Collision 模块
- Triggers 模块
- Sub Emitters 模块
- Texture Sheet Animation module
- Lights 模块
- Trails 模块
- Custom Data 模块
- Renderer 模块
- 粒子系统(旧版,3.5 版之前)
- 视觉效果参考
- 网格组件
- 纹理组件
- 渲染组件
- 渲染管线详细信息
- 精灵渲染器 (Sprite Renderer)
- 图形操作方法
- 图形教程
- 图形概述
- 物理系统
- 脚本
- 多玩家和联网
- Networking Overview
- Networking Reference
- NetworkAnimator
- NetworkBehaviour
- NetworkClient
- NetworkConnection
- NetworkDiscovery
- NetworkIdentity
- Network Lobby Manager
- Network Lobby Player
- NetworkManager
- Network Manager HUD
- Network Proximity Checker
- NetworkReader
- NetworkServer
- NetworkStartPosition
- NetworkTransform
- NetworkTransformChild
- NetworkTransformVisualizer
- NetworkTransport
- NetworkWriter
- 音频
- 动画
- 动画系统概述
- 动画剪辑
- Animator Controllers
- 重定向人形动画
- Performance and Optimization
- Animation Reference
- Animation HOWTOs
- 动画术语表
- UI
- 导航和寻路
- Unity 服务
- Virtual Reality
- 开源代码仓库
- Asset Store 发布
- 特定于平台的信息
- 独立平台
- Apple Mac
- WebGL
- 构建适用于 Apple TV 的游戏
- iOS
- Android
- Facebook 开发入门
- 三星电视
- Tizen
- Windows
- Windows 通用
- Windows Store Apps
- 准备开始
- Windows Store Apps: Deployment
- Windows Store Apps: Profiler
- Windows Store Apps: Command line arguments
- Windows Store Apps: Association launching
- AppCallbacks 类
- Windows Store Apps: WinRT API in C# scripts
- WSA Player Settings
- Windows 应用商店:Windows SDK
- 脚本后端
- 常见问题解答
- Windows Store Apps: Examples
- Windows Store Apps: Code snippets
- Known issues
- Windows Holographic
- Web 播放器
- 移动平台开发者检查清单
- 实验性
- 旧版主题
- 最佳实践指南
- 专家指南
- Unity User Manual (5.6)
- 脚本
- 脚本工具
- MonoDevelop
MonoDevelop
MonoDevelop is the integrated development environment (IDE) supplied with Unity. An IDE combines the familiar operation of a text editor with additional features for debugging and other project management tasks. The text editor will not be covered here since it is fairly intuitive, but the integration of the editor and debugger with Unity are described below.
Setting Up MonoDevelop
MonoDevelop is installed by default with Unity, although there is the option to exclude it from the installation on Windows. You should check that MonoDevelop is set as the external script editor in the Preferences (menu: Unity > Preferences and then select the External Tools panel). With this option enabled, Unity will launch MonoDevelop and use it as the default editor for all script files.
Setting Up the Debugger
To enable MonoDevelop’s source level debugging (see below for details) you should firstly check that the Editor Attaching option is enabled in the Preferences on the External Tools panel. Then, you should synchronize the Unity project with the MonoDevelop project (menu: Assets > Open C# Project). Also, make sure that the Development Build and Script Debugging options are enabled in the Build Settings for your target platform (menu: File > Build Settings).
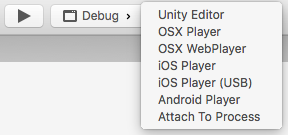
Just before starting a debugging session, select the target you wish to debug from the target list next to the play button (Unity Editor, OSX Player, etc.). You can also select “Attach To Process”, this will show the full list of debuggable Unity processes.

With these steps completed, you are ready to being debugging your Unity scripts by clicking the play button.
Source Level debugging
The currently open source files are shown as tabs in MonoDevelop and can be edited there with the features of a standard text editor. However, there is also a grey breakpoint bar to the left of the editor panel. Clicking in this bar will add a so-called breakpoint marker next to the line of code.

Adding a breakpoint to a line instructs Unity to pause execution of the script just before it reaches that line during Play mode. When the script is “frozen” like this, you can use the debugger to determine exactly what the script is doing.

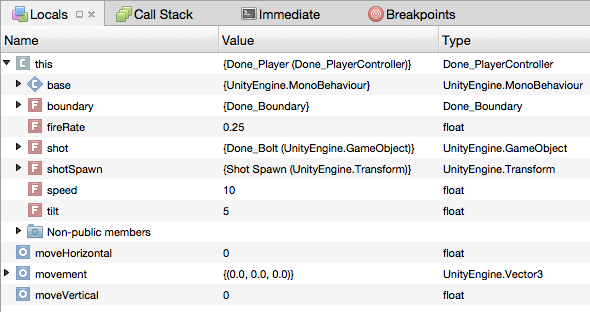
Information about the state of execution is shown in the tabs at the bottom of the MonoDevelop window when execution is paused at a breakpoint. Perhaps the most important of these is the Locals tab.

This shows the values of local variables in the function that is currently executing. (A pseudo-local variable called “this” is automatically available in every function without being explicitly defined; it is a reference to the current script instance and so all variables defined in the script can be accessed via “this”.) You can use breakpoints in combination with the Locals tab to get a similar effect to adding print statements to your code - you can interrogate the values of variables at any point you like. However, you can also edit the variable values in the Locals tab. This can be handy when you find a variable incorrectly set and you would like to see if the problem disappears when the value is set how it should be.
A further useful feature of MonoDevelop is single stepping. When execution is paused at a breakpoint, a bar of debugging tools will become available in the top portion of the MonoDevelop window:-

The four buttons are known as Continue, Step Over, Step In and Step Out and can also be accessed as commands on the Run menu. Continue resumes execution until the next breakpoint is encountered. Step Over and Step In both execute one line of code at a time. The difference between the two is that Step Over executes any function calls within the line all at once, while Step In allows the stepwise execution to continue into the function. Since it is common to use Step In accidentally on a function that is known to be correct, Step Out continues execution to the end of the current function and then pauses again in the code that originally called it.
A detailed description of source level debugging techniques is not appropriate here but there are various books and web resources offering wisdom on the subject. Additionally, a little experimentation will help you get a feel for the power of the technique and how you can use it to track down most common types of bugs.