Unity Manual
- Unity User Manual 2021.3 (LTS)
- New in Unity 2021 LTS
- Packages and feature sets
- Released packages
- 2D Animation
- 2D Aseprite Importer
- 2D Pixel Perfect
- 2D PSD Importer
- 2D SpriteShape
- 2D Tilemap Extras
- Adaptive Performance
- Addressables
- Ads Mediation
- Advertisement Legacy
- Alembic
- Analytics
- Android Logcat
- Animation Rigging
- Apple ARKit Face Tracking XR Plugin
- Apple ARKit XR Plugin
- AR Foundation
- Authentication
- Burst
- CCD Management
- Cinemachine
- Cloud Code
- Cloud Save
- Cloud Services Apis
- Code Coverage
- Collections
- Deployment
- Economy
- Editor Coroutines
- FBX Exporter
- Friends
- Google ARCore XR Plugin
- In App Purchasing
- Input System
- iOS 14 Advertising Support
- JetBrains Rider Editor
- Leaderboards
- Live Capture
- Lobby
- Localization
- Magic Leap XR Plugin
- Matchmaker
- Mathematics
- Microsoft GDK API
- Microsoft GDK Tools
- ML Agents
- Mobile Notifications
- Moderation
- Multiplay
- Multiplayer Tools
- Netcode for GameObjects
- Oculus XR Plugin
- OpenXR Plugin
- Player Accounts
- Polybrush
- Post Processing
- ProBuilder
- Profile Analyzer
- Push Notifications
- Recorder
- Relay
- Remote Config
- Scriptable Build Pipeline
- Sequences
- Services Tooling
- Sysroot Base
- Sysroot Linux x64
- Terrain Tools
- Test Framework
- TextMeshPro
- Timeline
- Toolchain Linux x64
- Toolchain MacOS Linux x64
- Toolchain Win Linux x64
- Tutorial Authoring Tools
- Tutorial Framework
- Unity Distribution Portal
- Unity Profiling Core API
- Unity Transport
- User Generated Content
- User Generated Content Bridge
- Version Control
- Visual Scripting
- Visual Studio Code Editor
- Visual Studio Editor
- Vivox
- WebGL Publisher
- XR Hands
- XR Interaction Toolkit
- XR Plugin Management
- Release Candidates
- Pre-release packages
- Core packages
- Built-in packages
- AI
- Android JNI
- Animation
- Asset Bundle
- Audio
- Cloth
- Director
- Image Conversion
- IMGUI
- JSONSerialize
- NVIDIA
- Particle System
- Physics
- Physics 2D
- Screen Capture
- Terrain
- Terrain Physics
- Tilemap
- UI
- UIElements
- Umbra
- Unity Analytics
- Unity Web Request
- Unity Web Request Asset Bundle
- Unity Web Request Audio
- Unity Web Request Texture
- Unity Web Request WWW
- Vehicles
- Video
- VR
- Wind
- XR
- Experimental packages
- Packages by keywords
- Unity's Package Manager
- How Unity works with packages
- Concepts
- Configuration
- Package Manager window
- Access the Package Manager window
- List view
- Details view
- Features (detail) view
- Finding packages and feature sets
- Add and remove UPM packages or feature sets
- Install a feature set from the Unity registry
- Install a UPM package from a registry
- Install a UPM package from the Asset Store
- Install a UPM package from a local folder
- Install a UPM package from a local tarball file
- Install a UPM package from a Git URL
- Install a UPM package by name
- Remove a UPM package from a project
- Switch to another version of a UPM package
- Add and remove asset packages
- Disable a built-in package
- Finding package documentation
- Inspecting packages
- Scripting API for packages
- Scoped registries
- Resolution and conflict
- Project manifest
- Troubleshooting
- Creating custom packages
- Feature sets
- Released packages
- Working in Unity
- Installing Unity
- System requirements for Unity 2021 LTS
- Install Unity using installer files
- Install Unity using Download Assistant
- Installing Unity from the command line
- Install Unity on offline computers
- Licenses and activation
- 2D or 3D projects
- Upgrading Unity
- Unity's interface
- Quickstart guides
- Advanced best practice guides
- Create Gameplay
- Editor Features
- Analysis
- Memory in Unity
- Profiler overview
- Profiling your application
- Common Profiler markers
- The Profiler window
- Asset Loading Profiler module
- Audio Profiler module
- CPU Usage Profiler module
- File Access Profiler module
- Global Illumination Profiler module
- GPU Usage Profiler module
- Memory Profiler module
- Physics Profiler module
- 2D Physics Profiler module
- Rendering Profiler module
- UI and UI Details Profiler
- Video Profiler module
- Virtual Texturing Profiler module
- Customizing the Profiler
- Low-level native plug-in Profiler API
- Profiling tools
- Log files
- Understanding optimization in Unity
- Asset loading metrics
- Installing Unity
- Asset Workflow
- Input
- 2D game development
- Introduction to 2D
- 2D game development quickstart guide
- 2D Sorting
- Work with sprites
- Import images as sprites
- Sort sprites
- Sprite Renderer
- Sprite Creator
- Sprite Editor
- Sorting Groups
- 9-slicing Sprites
- Sprite Masks
- Sprite Atlas
- Sprite Shape Renderer
- Tilemaps
- Physics Reference 2D
- Graphics
- Render pipelines
- Render pipelines introduction
- # Render pipeline feature comparison
- How to get, set, and configure the active render pipeline
- Choosing and configuring a render pipeline and lighting solution
- Using the Built-in Render Pipeline
- Using the Universal Render Pipeline
- Using the High Definition Render Pipeline
- Scriptable Render Pipeline fundamentals
- Creating a custom render pipeline
- Cameras
- Lighting
- Introduction to lighting
- Light sources
- Shadows
- The Lighting window
- Lighting Settings Asset
- The Light Explorer window
- Lightmapping
- Realtime Global Illumination using Enlighten
- Light Probes
- Reflection Probes
- Precomputed lighting data
- Scene View Draw Modes for lighting
- Models
- Meshes
- Textures
- Importing Textures
- Texture formats
- Mipmaps
- Render Texture
- Custom Render Textures
- Movie Textures
- 3D textures
- Texture arrays
- Cubemaps
- Cubemap arrays
- Streaming Virtual Texturing
- Streaming Virtual Texturing requirements and compatibility
- How Streaming Virtual Texturing works
- Enabling Streaming Virtual Texturing in your project
- Using Streaming Virtual Texturing in Shader Graph
- Cache Management for Virtual Texturing
- Marking textures as "Virtual Texturing Only"
- Virtual Texturing error material
- Sparse Textures
- Loading texture and mesh data
- Shaders
- Shaders core concepts
- Built-in shaders
- Standard Shader
- Standard Particle Shaders
- Autodesk Interactive shader
- Legacy Shaders
- Using Shader Graph
- Writing shaders
- Writing shaders overview
- ShaderLab
- ShaderLab: defining a Shader object
- ShaderLab: defining a SubShader
- ShaderLab: defining a Pass
- ShaderLab: adding shader programs
- ShaderLab: specifying package requirements
- ShaderLab: commands
- ShaderLab: grouping commands with the Category block
- ShaderLab command: AlphaToMask
- ShaderLab command: Blend
- ShaderLab command: BlendOp
- ShaderLab command: ColorMask
- ShaderLab command: Conservative
- ShaderLab command: Cull
- ShaderLab command: Offset
- ShaderLab command: Stencil
- ShaderLab command: UsePass
- ShaderLab command: GrabPass
- ShaderLab command: ZClip
- ShaderLab command: ZTest
- ShaderLab command: ZWrite
- ShaderLab legacy functionality
- HLSL in Unity
- Preprocessor directives in HLSL
- Shader semantics
- Accessing shader properties in Cg/HLSL
- Providing vertex data to vertex programs
- Built-in shader include files
- Built-in macros
- Built-in shader helper functions
- Built-in shader variables
- HLSL data types
- Use 16-bit precision in shaders
- Using sampler states
- GLSL in Unity
- Example shaders
- Writing Surface Shaders
- Writing shaders for different graphics APIs
- Understanding shader performance
- Materials
- Visual effects
- Post-processing and full-screen effects
- Particle systems
- Choosing your particle system solution
- Built-in Particle System
- Using the Built-in Particle System
- Particle System vertex streams and Standard Shader support
- Particle System GPU Instancing
- Particle System C# Job System integration
- Components and Modules
- Particle System
- Particle System modules
- Main module
- Emission module
- Shape module
- Velocity over Lifetime module
- Noise module
- Limit Velocity over Lifetime module
- Inherit Velocity module
- Lifetime by Emitter Speed module
- Force over Lifetime module
- Color over Lifetime module
- Color by Speed module
- Size over Lifetime module
- Size by Speed module
- Rotation over Lifetime module
- Rotation by Speed module
- External Forces module
- Collision module
- Triggers module
- Sub Emitters module
- Texture Sheet Animation module
- Lights module
- Trails module
- Custom Data module
- Renderer module
- Particle System Force Field
- Visual Effect Graph
- Decals and projectors
- Lens flares and halos
- Lines, trails, and billboards
- Sky
- Color
- Graphics performance and profiling
- Render pipelines
- World building
- Physics
- Built-in 3D Physics
- Character control
- Rigidbody physics
- Collision
- Joints
- Articulations
- Ragdoll physics
- Cloth
- Multi-scene physics
- Built-in 3D Physics
- Scripting
- Setting Up Your Scripting Environment
- Scripting concepts
- Important Classes
- Unity architecture
- Plug-ins
- Job system
- UnityWebRequest
- Multiplayer
- Audio
- Audio overview
- Audio files
- Tracker Modules
- Audio Mixer
- Native audio plug-in SDK
- Audio Profiler
- Ambisonic Audio
- Audio Reference
- Audio Clip
- Audio Listener
- Audio Source
- Audio Mixer
- Audio Filters
- Audio Effects
- Audio Low Pass Effect
- Audio High Pass Effect
- Audio Echo Effect
- Audio Flange Effect
- Audio Distortion Effect
- Audio Normalize Effect
- Audio Parametric Equalizer Effect
- Audio Pitch Shifter Effect
- Audio Chorus Effect
- Audio Compressor Effect
- Audio SFX Reverb Effect
- Audio Low Pass Simple Effect
- Audio High Pass Simple Effect
- Reverb Zones
- Microphone
- Audio Settings
- Video and cutscenes
- Animation
- Animation system overview
- Rotation in animations
- Animation Clips
- Animator Controllers
- Retargeting of Humanoid animations
- Performance and optimization
- Animation Reference
- Animation FAQ
- Playables API
- A Glossary of animation terms
- Legacy Animation system
- User interface (UI)
- Comparison of UI systems in Unity
- UI Toolkit
- Get started with UI Toolkit
- UI Builder
- Structure UI
- The visual tree
- Structure UI with UXML
- Structure UI with C# scripts
- Custom controls
- Best practices for managing elements
- Encapsulate UXML documents with logic
- UXML elements reference
- UXML element BindableElement
- UXML element VisualElement
- UXML element BoundsField
- UXML element BoundsIntField
- UXML element Box
- UXML element Button
- UXML element ColorField
- UXML element CurveField
- UXML element DoubleField
- UXML element DropdownField
- UXML element EnumField
- UXML element EnumFlagsField
- UXML element FloatField
- UXML element Foldout
- UXML element GradientField
- UXML element GroupBox
- UXML element Hash128Field
- UXML element HelpBox
- UXML element IMGUIContainer
- UXML element Image
- UXML element InspectorElement
- UXML element IntegerField
- UXML element Label
- UXML element LayerField
- UXML element LayerMaskField
- UXML element LongField
- UXML element ListView
- UXML element MaskField
- UXML element MinMaxSlider
- UXML element ObjectField
- UXML element PopupWindow
- UXML element ProgressBar
- UXML element PropertyField
- UXML element RadioButton
- UXML element RadioButtonGroup
- UXML element RectField
- UXML element RectIntField
- UXML element RepeatButton
- UXML element ScrollView
- UXML element Scroller
- UXML element Slider
- UXML element SliderInt
- UXML element TagField
- UXML element TextElement
- UXML element TextField
- UXML element TemplateContainer
- UXML element Toggle
- UXML element Toolbar
- UXML element ToolbarBreadcrumbs
- UXML element ToolbarButton
- UXML element ToolbarMenu
- UXML element ToolbarPopupSearchField
- UXML element ToolbarSearchField
- UXML element ToolbarSpacer
- UXML element ToolbarToggle
- UXML element TwoPaneSplitView
- UXML element Vector2Field
- UXML element Vector2IntField
- UXML element Vector3Field
- UXML element Vector3IntField
- UXML element Vector4Field
- Structure UI examples
- Create a complex list view
- Create a list view runtime UI
- Wrap content inside a scroll view
- Create a tabbed menu for runtime
- Create a pop-up window
- Use Toggle to create a conditional UI
- Create a custom control with two attributes
- Create a slide toggle custom control
- Use Mesh API to create a radial progress indicator
- Create a bindable custom control
- Create a custom style for a custom control
- Style UI
- UI Toolkit Debugger
- Control behavior with events
- Support for Editor UI
- Create a custom Editor window
- Create a Custom Inspector
- SerializedObject data binding
- Bindable elements reference
- Bindable data types and fields
- Binding system implementation details
- Binding examples
- Bind with binding path in C# script
- Bind without the binding path
- Bind with UXML and C# script
- Create a binding with the Inspector
- Bind to nested properties
- Bind to a UXML template
- Receive callbacks when a bound property changes
- Receive callbacks when any bound properties change
- Bind to a list with ListView
- Bind to a list without ListView
- Bind a custom control
- Bind a custom control to custom data type
- View data persistence
- Support for runtime UI
- Work with text
- Examples
- Migration guides
- Unity UI
- Immediate Mode GUI (IMGUI)
- Navigation and Pathfinding
- Navigation Overview
- Navigation System in Unity
- Inner Workings of the Navigation System
- Building a NavMesh
- NavMesh building components
- Advanced NavMesh Bake Settings
- Creating a NavMesh Agent
- Creating a NavMesh Obstacle
- Creating an OffMesh Link
- Building OffMesh Links Automatically
- Building Height Mesh for Accurate Character Placement
- Navigation Areas and Costs
- Loading Multiple NavMeshes using Additive Loading
- Using NavMesh Agent with Other Components
- Navigation Reference
- Navigation How-Tos
- Navigation Overview
- Unity Services
- Setting up your project for Unity services
- Unity Organizations
- Unity Ads
- Unity Analytics
- Unity Cloud Content Delivery
- Unity Build Automation (formerly Cloud Build)
- Unity IAP
- Setting up Unity IAP
- Cross Platform Guide
- Codeless IAP
- Defining products
- Subscription Product support
- Initialization
- Browsing Product Metadata
- Initiating Purchases
- Processing Purchases
- Handling purchase failures
- Restoring Transactions
- Purchase Receipts
- Receipt validation
- Store Extensions
- Cross-store installation issues with Android in-app purchase stores
- Store Guides
- Implementing a Store
- Unity Cloud Diagnostics
- Unity Integrations
- Multiplayer Services
- Unity Distribution Portal
- Unity Accelerator
- Unity's Asset Store
- Asset Store packages
- Publishing to the Asset Store
- Creating your Publisher Account
- Creating a new package draft
- Deleting a package draft
- Uploading assets to your package
- Filling in the package details
- Submitting your package for approval
- Viewing the status of your Asset Store submissions
- Collecting revenue
- Providing support to your customers
- Adding tags to published packages
- Connecting your account to Google Analytics
- Promoting your Assets
- Refunding your customers
- Upgrading packages
- Deprecating your Assets
- Issuing vouchers
- Managing your publishing team
- Asset Store Publisher portal
- Platform development
- Cross-platform features and considerations
- Android
- Introducing Android
- Getting started with Android
- Developing for Android
- Android mobile scripting
- Input for Android devices
- Android application size restrictions
- Graphics for Android
- Testing and debugging
- Create and use plug-ins in Android
- Integrating Unity into Android applications
- Deep linking on Android
- Android thread configuration
- Device features and permissions
- Handle Android crashes
- Quit a Unity Android application
- Building and delivering for Android
- Chrome OS
- Dedicated Server
- Embedded systems
- iOS
- Introducing iOS
- Getting started with iOS
- Developing for iOS
- Building and delivering for iOS
- Linux
- macOS
- tvOS
- Universal Windows Platform
- Introduction to Universal Windows Platform
- Get started with Universal Windows Platform
- Develop for Universal Windows Platform
- Build and deliver for Universal Windows Platform
- WebGL
- WebGL introduction
- WebGL development
- WebGL Player settings
- Interaction with browser scripting
- Code examples: Call JavaScript and C/C++/C# functions in Unity
- Set up your JavaScript plug-in
- Call JavaScript functions from Unity C# scripts
- Call Unity C# script functions from JavaScript
- Call C/C++/C# functions from Unity C# scripts
- Compile a static library as a Unity plug-in
- Create callbacks between Unity C#, JavaScript, and C/C++/C# code
- Replace deprecated browser interaction code
- WebGL native plug-ins for Emscripten
- Memory in Unity WebGL
- WebGL graphics
- Audio in WebGL
- Texture compression in WebGL
- Embedded Resources on WebGL
- Input in WebGL
- Configure a WebGL Canvas size
- WebGL networking
- WebGL performance considerations
- Debug and troubleshoot WebGL builds
- Building and distributing a WebGL project
- Windows
- XR
- Unity Search
- Glossary
- Graphics
- Graphics performance and profiling
- The Frame Debugger window
The Frame Debugger window
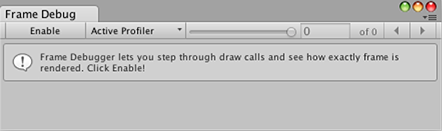
The Frame Debugger lets you freeze playback for a running game on a particular frame and view the individual draw calls that are used to render that frame. As well as listing the drawcalls, the debugger also lets you step through them one-by-one so you can see in great detail how the SceneA Scene contains the environments and menus of your game. Think of each unique Scene file as a unique level. In each Scene, you place your environments, obstacles, and decorations, essentially designing and building your game in pieces. More info
See in Glossary is constructed from its graphical elements.

Using the Frame Debugger
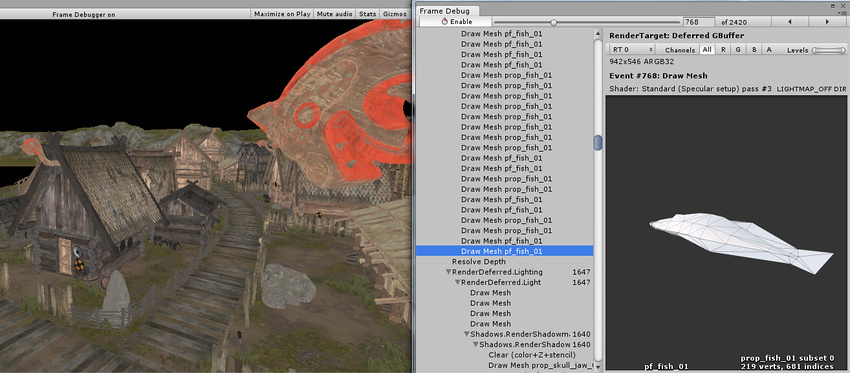
The Frame Debugger window (menu: Window > Analysis > Frame Debugger) shows the drawcall information and lets you control the “playback” of the frame under construction.
The main list shows the sequence of drawcalls (and other events like framebuffer clear) in the form of a hierarchy that identifies where they originated from. The panel to the right of the list gives further information about the drawcall such as the geometry details and the shaderA program that runs on the GPU. More info
See in Glossary used for rendering.
Clicking on an item from the list will show the Scene (in the Game view) as it appears up to and including that drawcall. The left and right arrow buttons in the toolbarA row of buttons and basic controls at the top of the Unity Editor that allows you to interact with the Editor in various ways (e.g. scaling, translation). More info
See in Glossary move forward and backward in the list by a single step and you can also use the arrow keys to the same effect. Additionally, the slider at the top of the window lets you “scrub” rapidly through the drawcalls to locate an item of interest quickly. Where a drawcall corresponds to the geometry of a GameObjectThe fundamental object in Unity scenes, which can represent characters, props, scenery, cameras, waypoints, and more. A GameObject’s functionality is defined by the Components attached to it. More info
See in Glossary, that object will be highlighted in the main Hierarchy panel to assist identification.
If rendering happens into a RenderTexture at the selected draw call, then contents of that RenderTexture are displayed in the Game view. This is useful for inspecting how various off-screen render targets are built up, for example diffuse G-buffer in deferred shadingA rendering path in the Built-in Render Pipeline that places no limit on the number of Lights that can affect a GameObject. All Lights are evaluated per-pixel, which means that they all interact correctly with normal maps and so on. Additionally, all Lights can have cookies and shadows. More info
See in Glossary:
Or looking at how the shadow maps are rendered:
Remote Frame Debugger
To use Frame Debugger remotely, the player has to support multithreaded rendering (for example, WebGL doesn’t support it, thus frame debugger cannot be run on it), most of the Unity platforms support it, secondly you have to check ‘Development BuildA development build includes debug symbols and enables the Profiler. More info
See in Glossary’ when building.
Note for Desktop platforms: be sure to check ‘Run In Background’ option before building, otherwise, when you’ll connect Frame Debugger to player, it won’t reflect any rendering changes until it has focus, assuming you’re running both Editor and the player on the same machine, when you’ll control Frame Debugger in Editor, you’ll take the focus from the player.
Quick Start:
- From Editor build the project to target platform (select Development Player)
- Run the player
- Go back to the Editor
- Open Frame Debugger window
- Click Active ProfilerA window that helps you to optimize your game. It shows how much time is spent in the various areas of your game. For example, it can report the percentage of time spent rendering, animating, or in your game logic. More info
See in Glossary, select the player - Click Enable, frame debugger should enable on the player
Render target display options
At the top of the information panel is a toolbar which lets you isolate the red, green, blue and alpha channels for the current state of the Game view. Similarly, you can isolate areas of the view according to brightness levels using the Levels slider to the right of these channel buttons. These are only enabled when rendering into a RenderTexture.
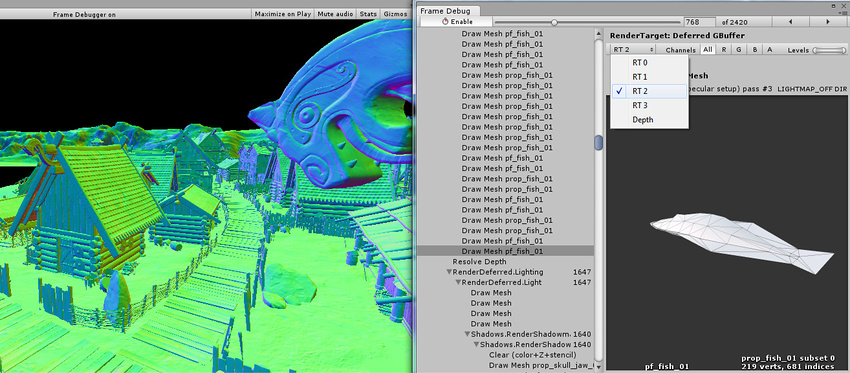
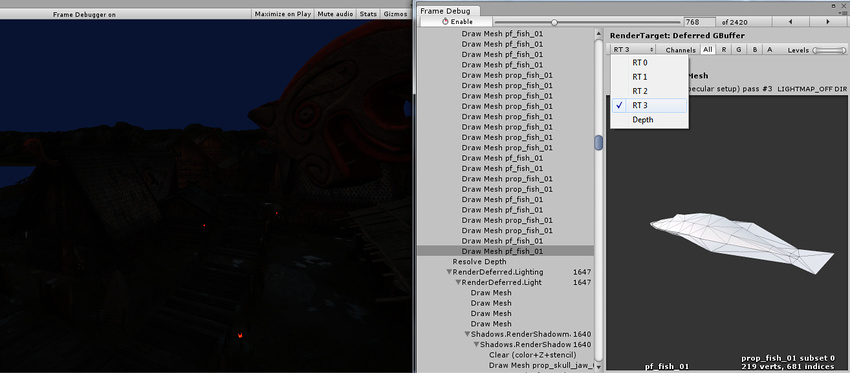
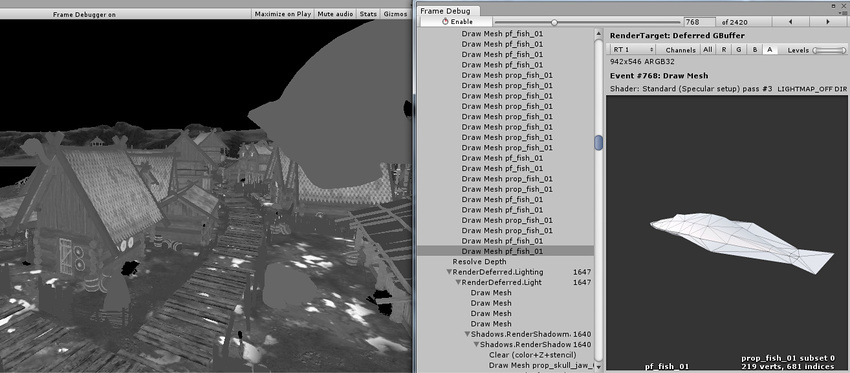
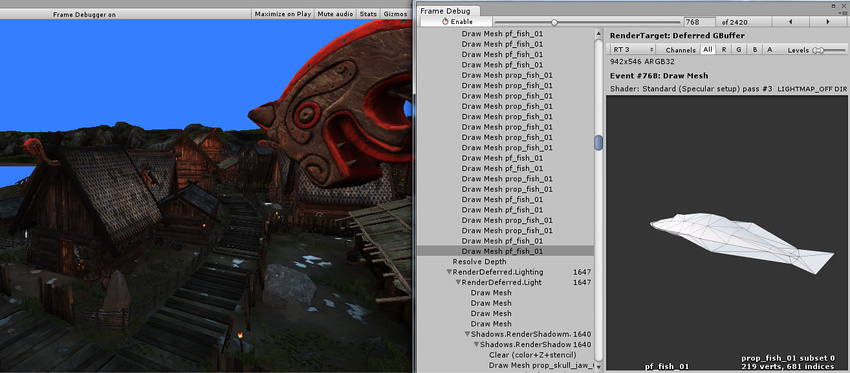
When rendering into multiple render targets at once you can select which one to display in the game view. Shown here are the diffuse, specular, normals and emission/indirect lighting buffers in 5.0 deferred shading mode, respectively:

Additionally, you can see the depth bufferA memory store that holds the z-value depth of each pixel in an image, where the z-value is the depth for each rendered pixel from the projection plane. More info
See in Glossary contents by picking “Depth” from the dropdown:

By isolating alpha channel of the render textureA special type of Texture that is created and updated at runtime. To use them, first create a new Render Texture and designate one of your Cameras to render into it. Then you can use the Render Texture in a Material just like a regular Texture. More info
See in Glossary, you can see occlusion (stored in RT0 alpha) and smoothness (stored in RT1 alpha) of the deferred G-buffer:

The emission and ambient/indirect lighting in this Scene is very dark; we can make it more visible by changing the Levels slider:
Viewing shader property values
For draw calls, the Frame Debugger can also show shader property values that are used. Click on “Shader Properties” tab to show them:
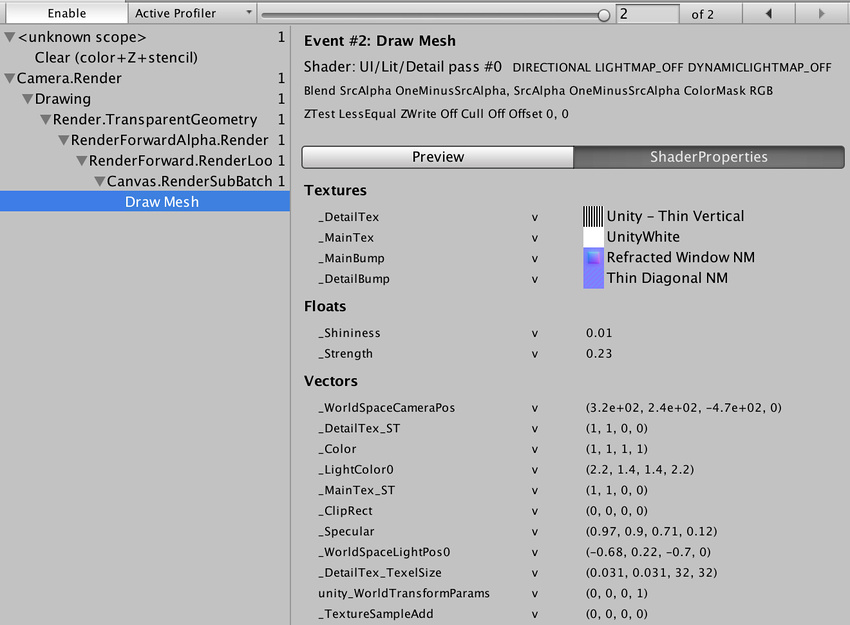
For each property, the value is shown, as well as which shader stages
it was used in (vertex, fragment, geometry, hull, domain). Note that when using OpenGL (e.g. on a Mac), all shader properties are considered to be part of vertex shaderA program that runs on each vertex of a 3D model when the model is being rendered. More info
See in Glossary stage, due to how GLSL shaders work.
In the editor, thumbnails for textures are displayed too, and clicking
on them highlights the textures in the project windowA window that shows the contents of your Assets folder (Project tab) More info
See in Glossary.
Alternative frame debugging techniques
You could also use external tools to debug rendering. Editor integration exists for easily launching RenderDoc to inspect the Scene or Game view in the Editor.
You can also build a standalone player and run it through any of the following:
- Visual Studio graphics debugger
- Intel GPA
- RenderDoc
- NVIDIA NSight
- AMD GPU PerfStudio
- Xcode GPU Frame Capture
- GPU Driver Instruments
When you’ve done this, capture a frame of rendering, then step through the draw calls and other rendering events to see what’s going on. This is a very powerful approach, because these tools can provide you with a lot of information to really drill down.
Did you find this page useful? Please give it a rating:
Thanks for rating this page!
What kind of problem would you like to report?
Thanks for letting us know! This page has been marked for review based on your feedback.
If you have time, you can provide more information to help us fix the problem faster.
Provide more information
You've told us this page needs code samples. If you'd like to help us further, you could provide a code sample, or tell us about what kind of code sample you'd like to see:
You've told us there are code samples on this page which don't work. If you know how to fix it, or have something better we could use instead, please let us know:
You've told us there is information missing from this page. Please tell us more about what's missing:
You've told us there is incorrect information on this page. If you know what we should change to make it correct, please tell us:
You've told us this page has unclear or confusing information. Please tell us more about what you found unclear or confusing, or let us know how we could make it clearer:
You've told us there is a spelling or grammar error on this page. Please tell us what's wrong:
You've told us this page has a problem. Please tell us more about what's wrong:
Thank you for helping to make the Unity documentation better!
Your feedback has been submitted as a ticket for our documentation team to review.
We are not able to reply to every ticket submitted.
Copyright © 2025 Unity Technologies. Publication Date: 2025-02-27.